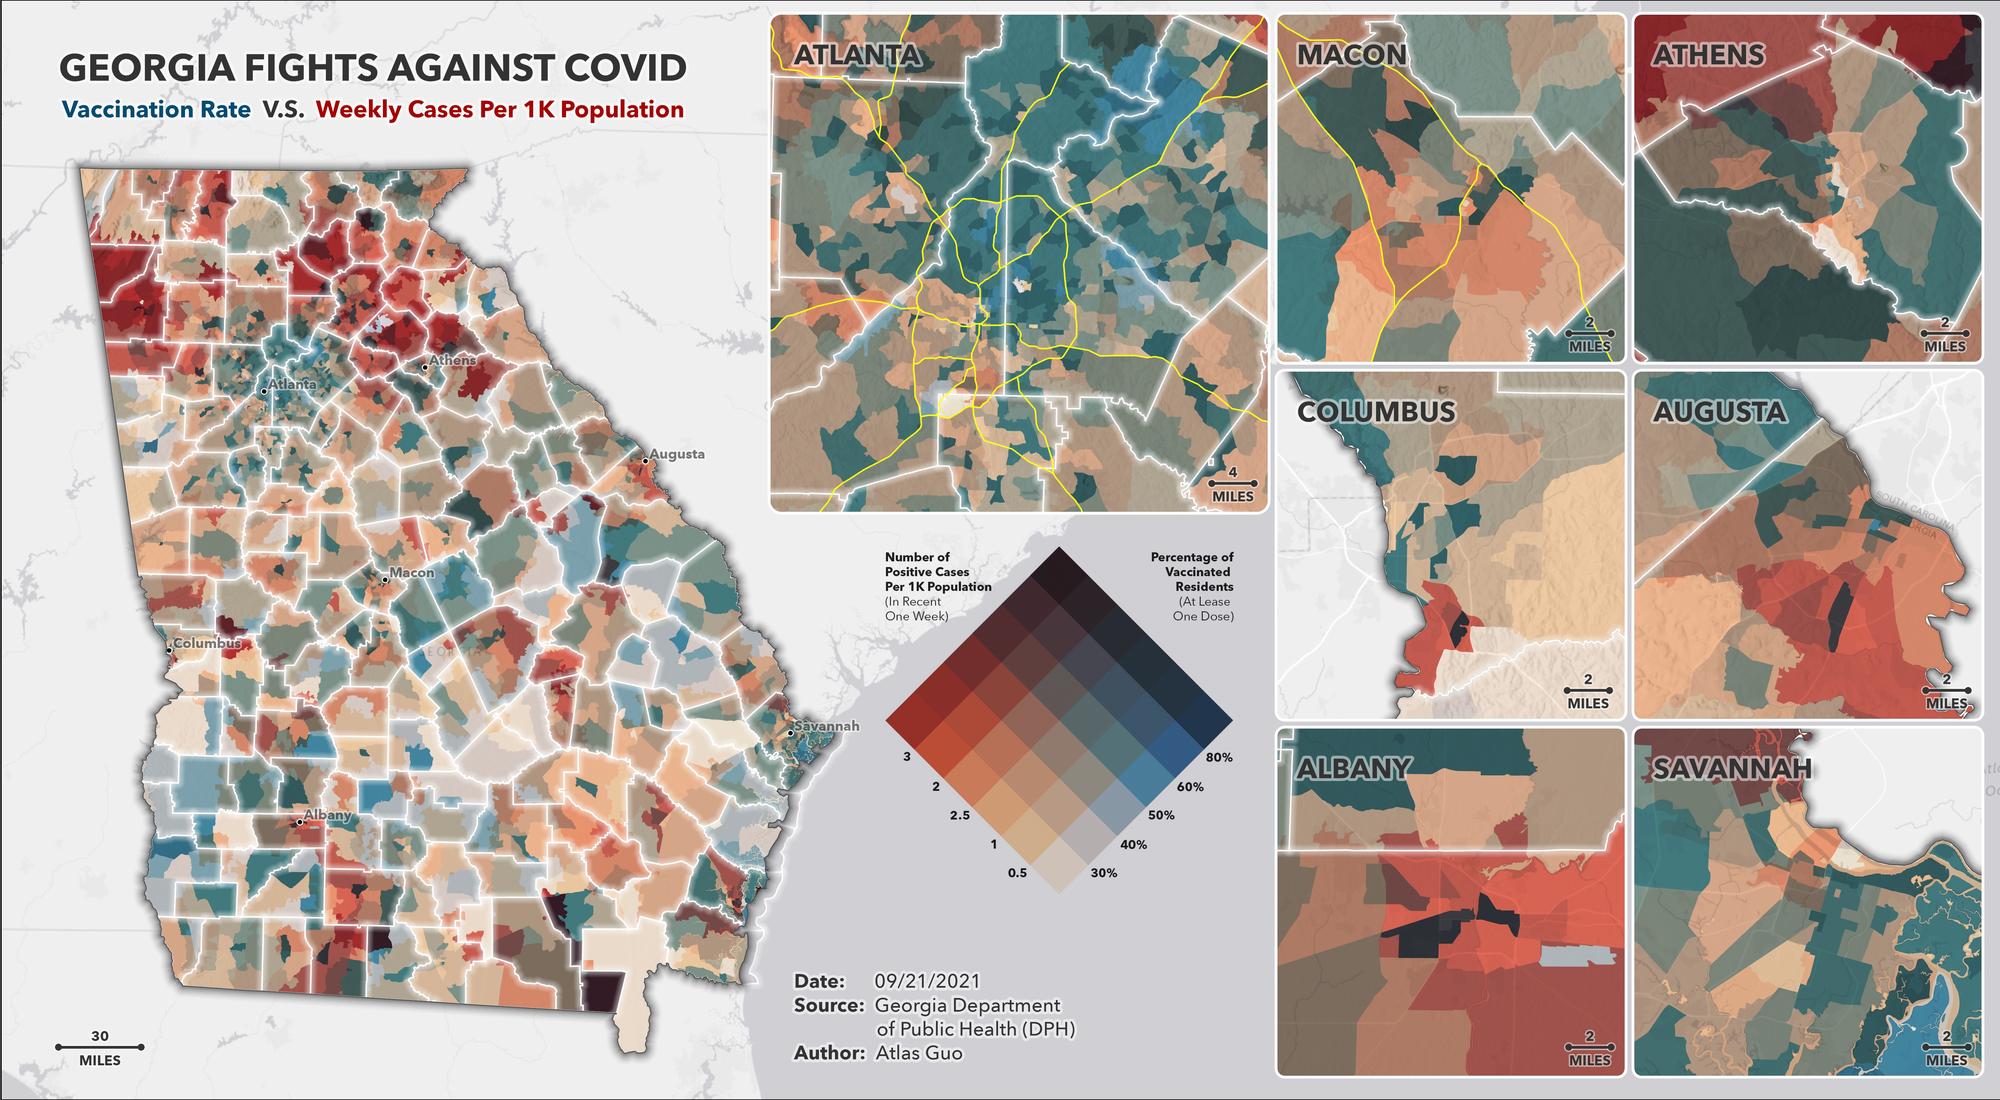
Georgia Fights Against COVID
Bivariate choropleth map visualizing the COVID case per capita vs. vaccination rate in recent week
 Download Compressed Image
Download Full-Size Image
This is a bivariate choropleth map visualizing the vaccination rate (blue) and weekly cases per 1K
population. The static map show the census track level COVID condition in the state
of Georgia, as well as major cities: Atlanta, Macon, Columbus, Augusta, Albany and Savannah (inset maps
generally reflect their geographic location).
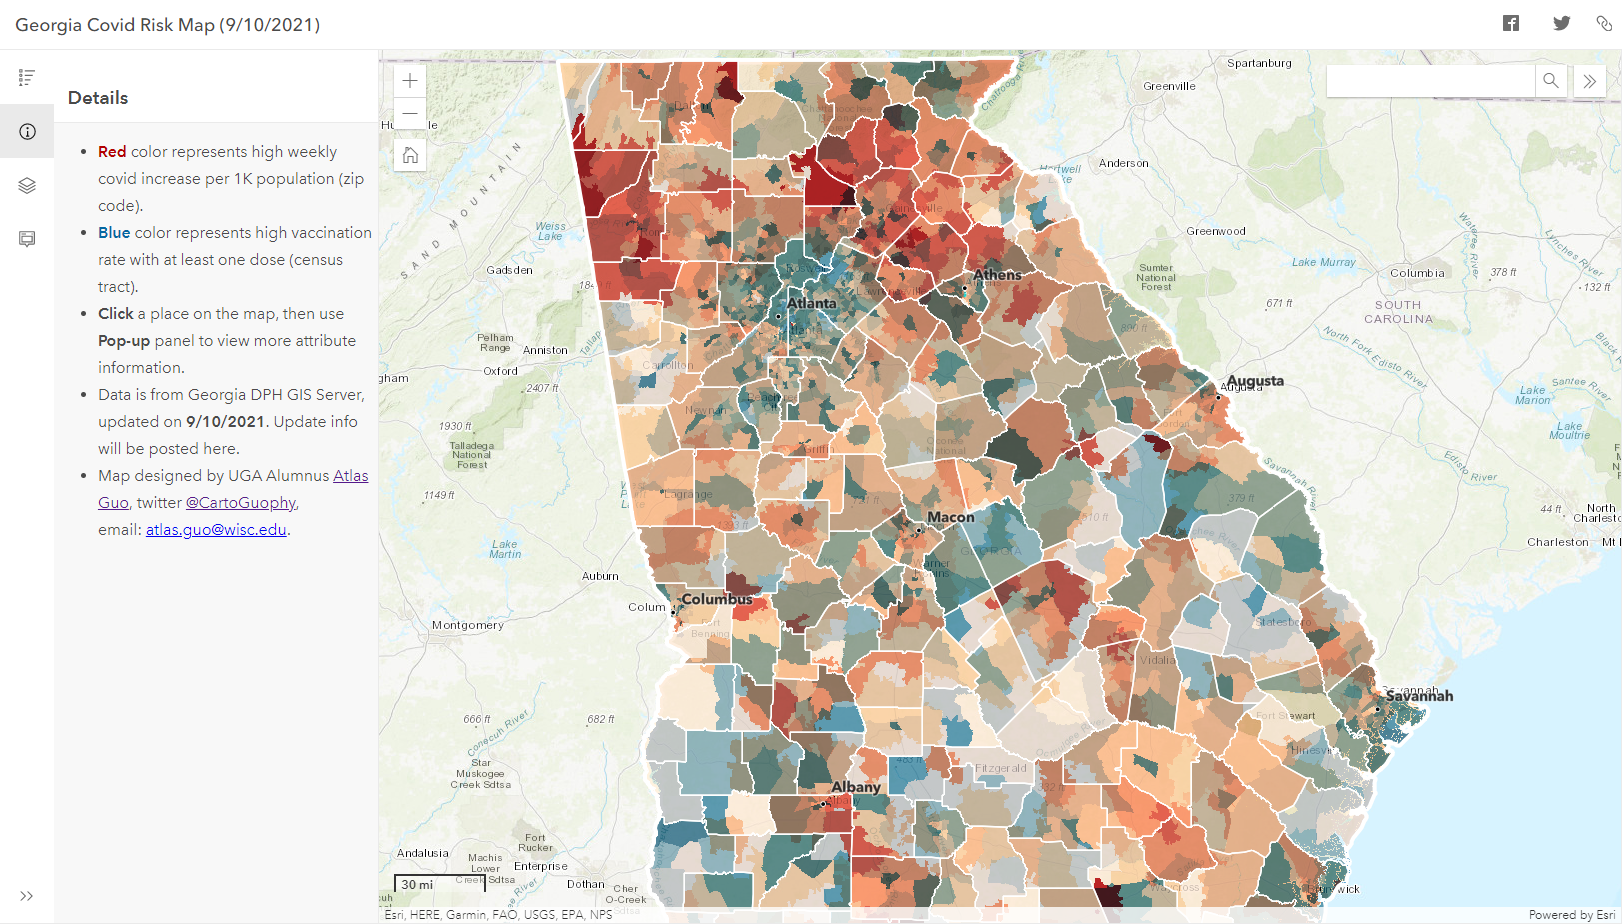
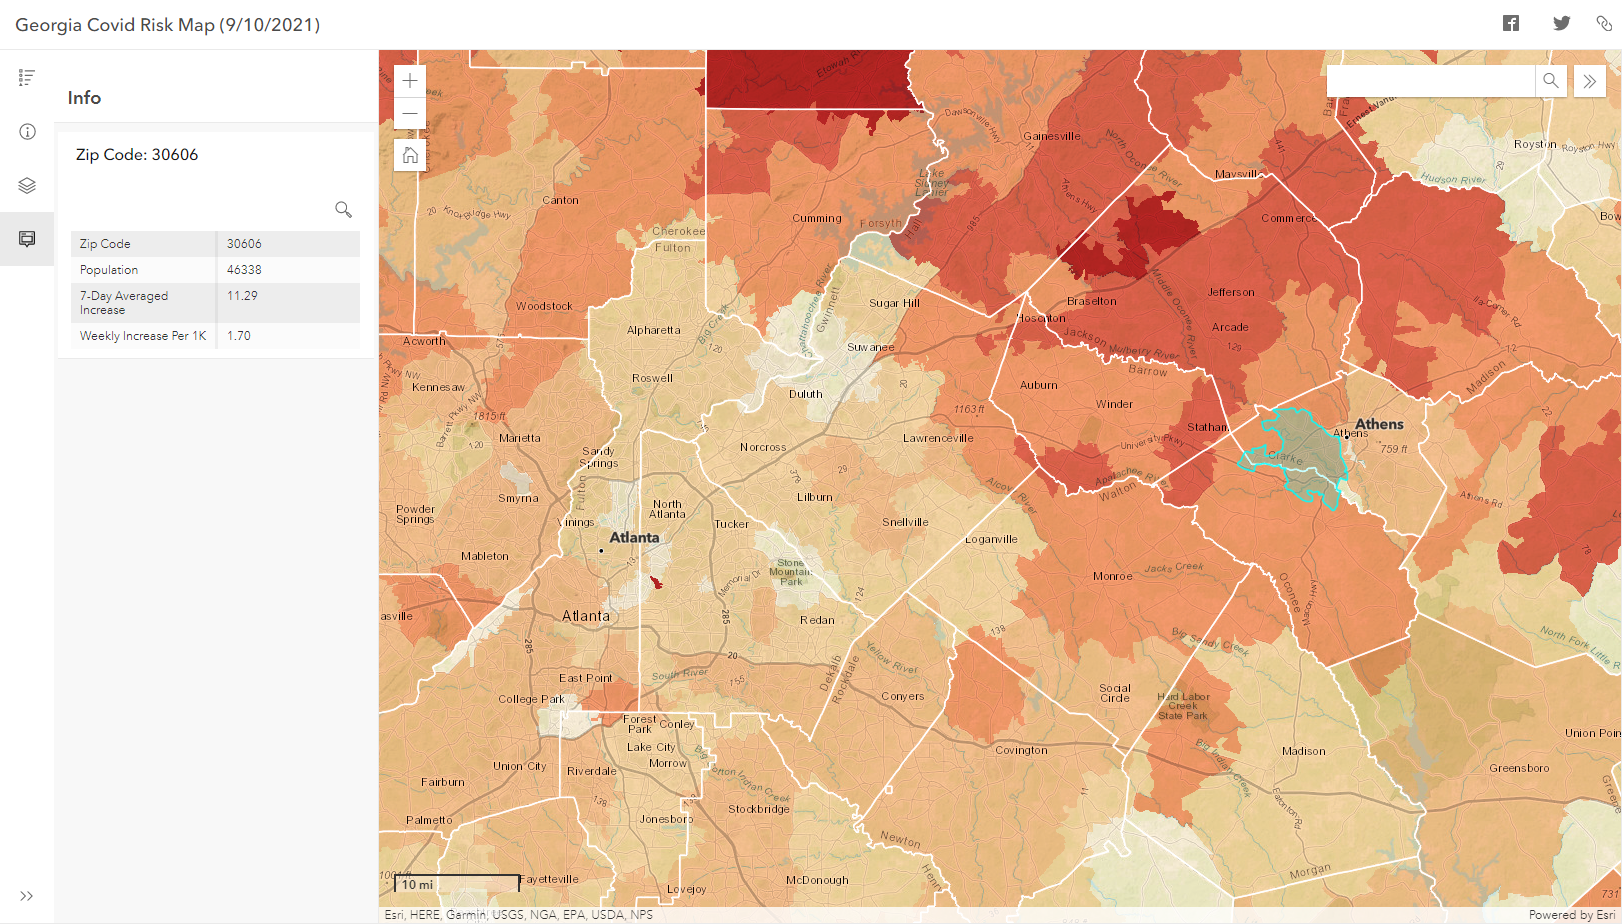
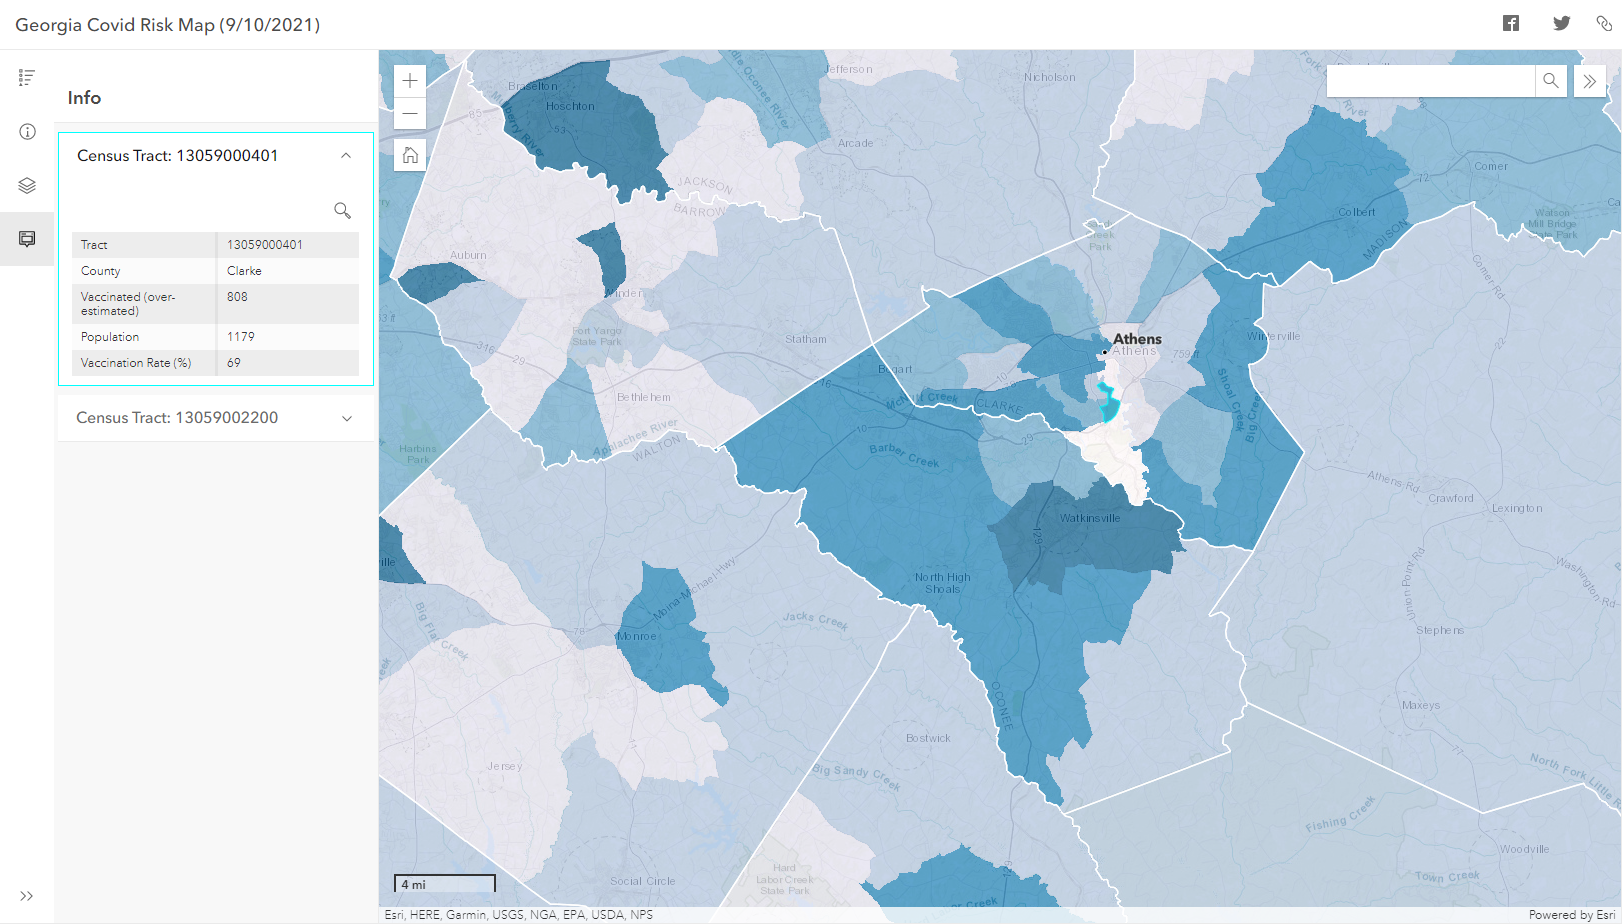
This map shows the COVID conditions in September of 2021, where I was living at Georgia. I also made a
web version of this map which updates weekly and serve more Georgian.