Global Temperature Patterns
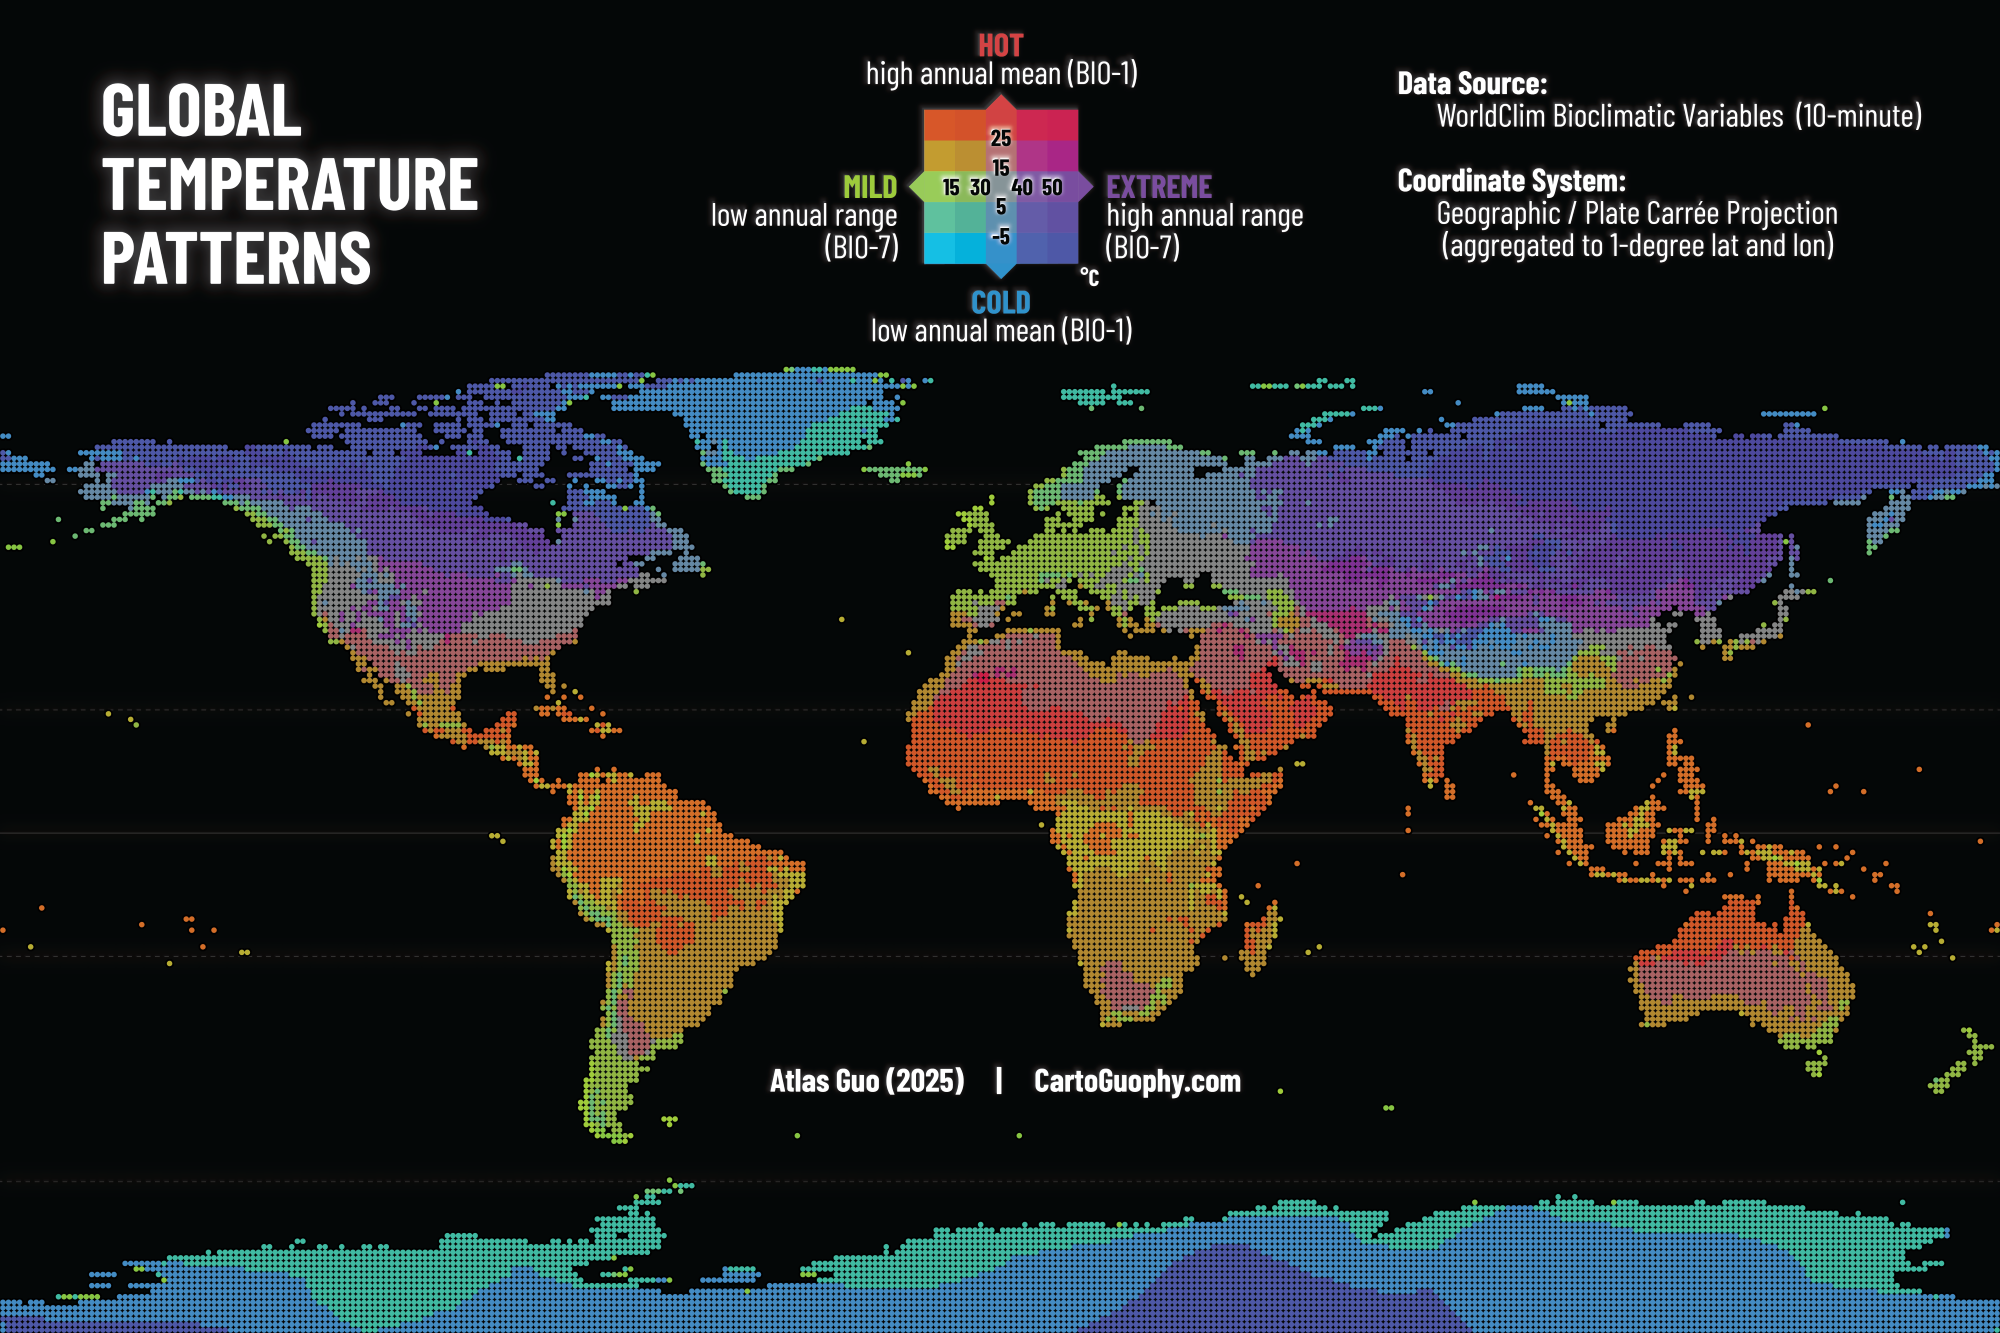
Bivariate mapping of global temperature mean and range using WorldClim dataset
 Download Compressed Image
Download Full-Size Image
This map illustrates global temperature patterns based on WorldClim bioclimatic variables. It classifies the world’s land areas according to their long-term thermal characteristics, combining annual mean temperature (BIO-1) and annual temperature range (BIO-7). Data were aggregated to a 1-degree grid using a Plate Carrée projection (geographic coordinates).
This map was displayed in the map gallery (postcard / tiny map) of North American Cartographic Information Society (NACIS) 2025 annual meeting at Louisiville, KY (Oct 15-17). Check out my other entries in the map gallery!