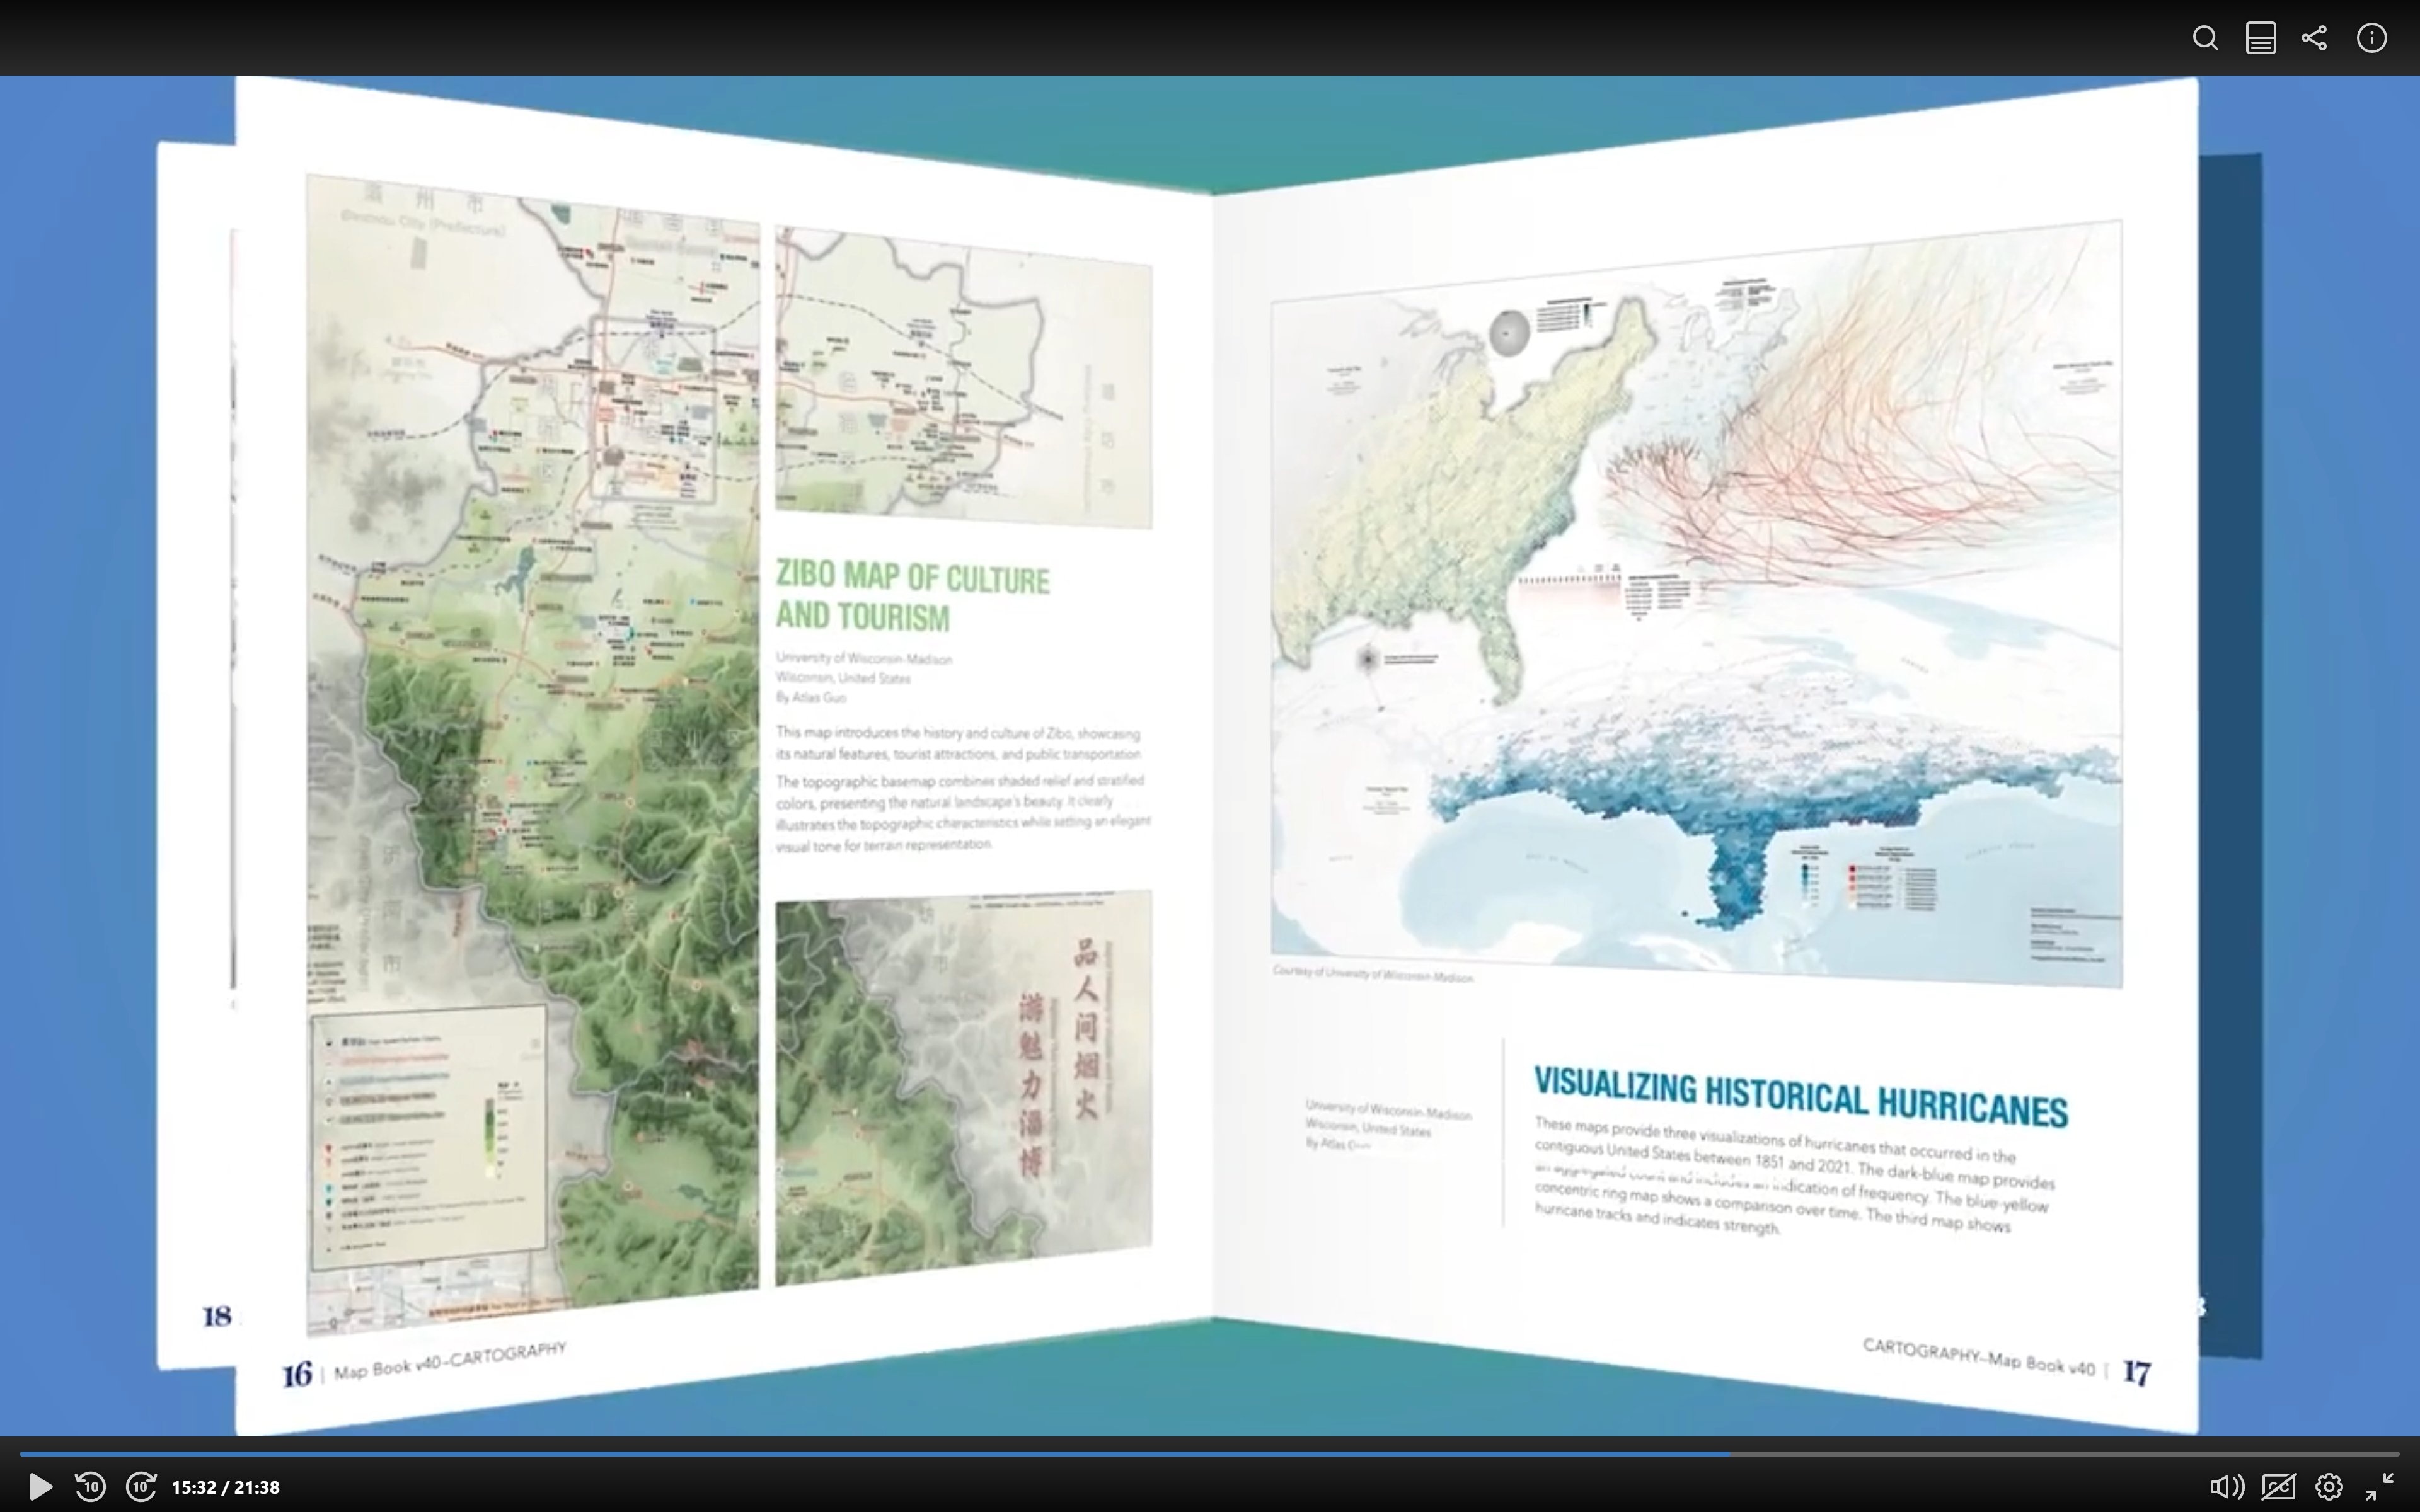
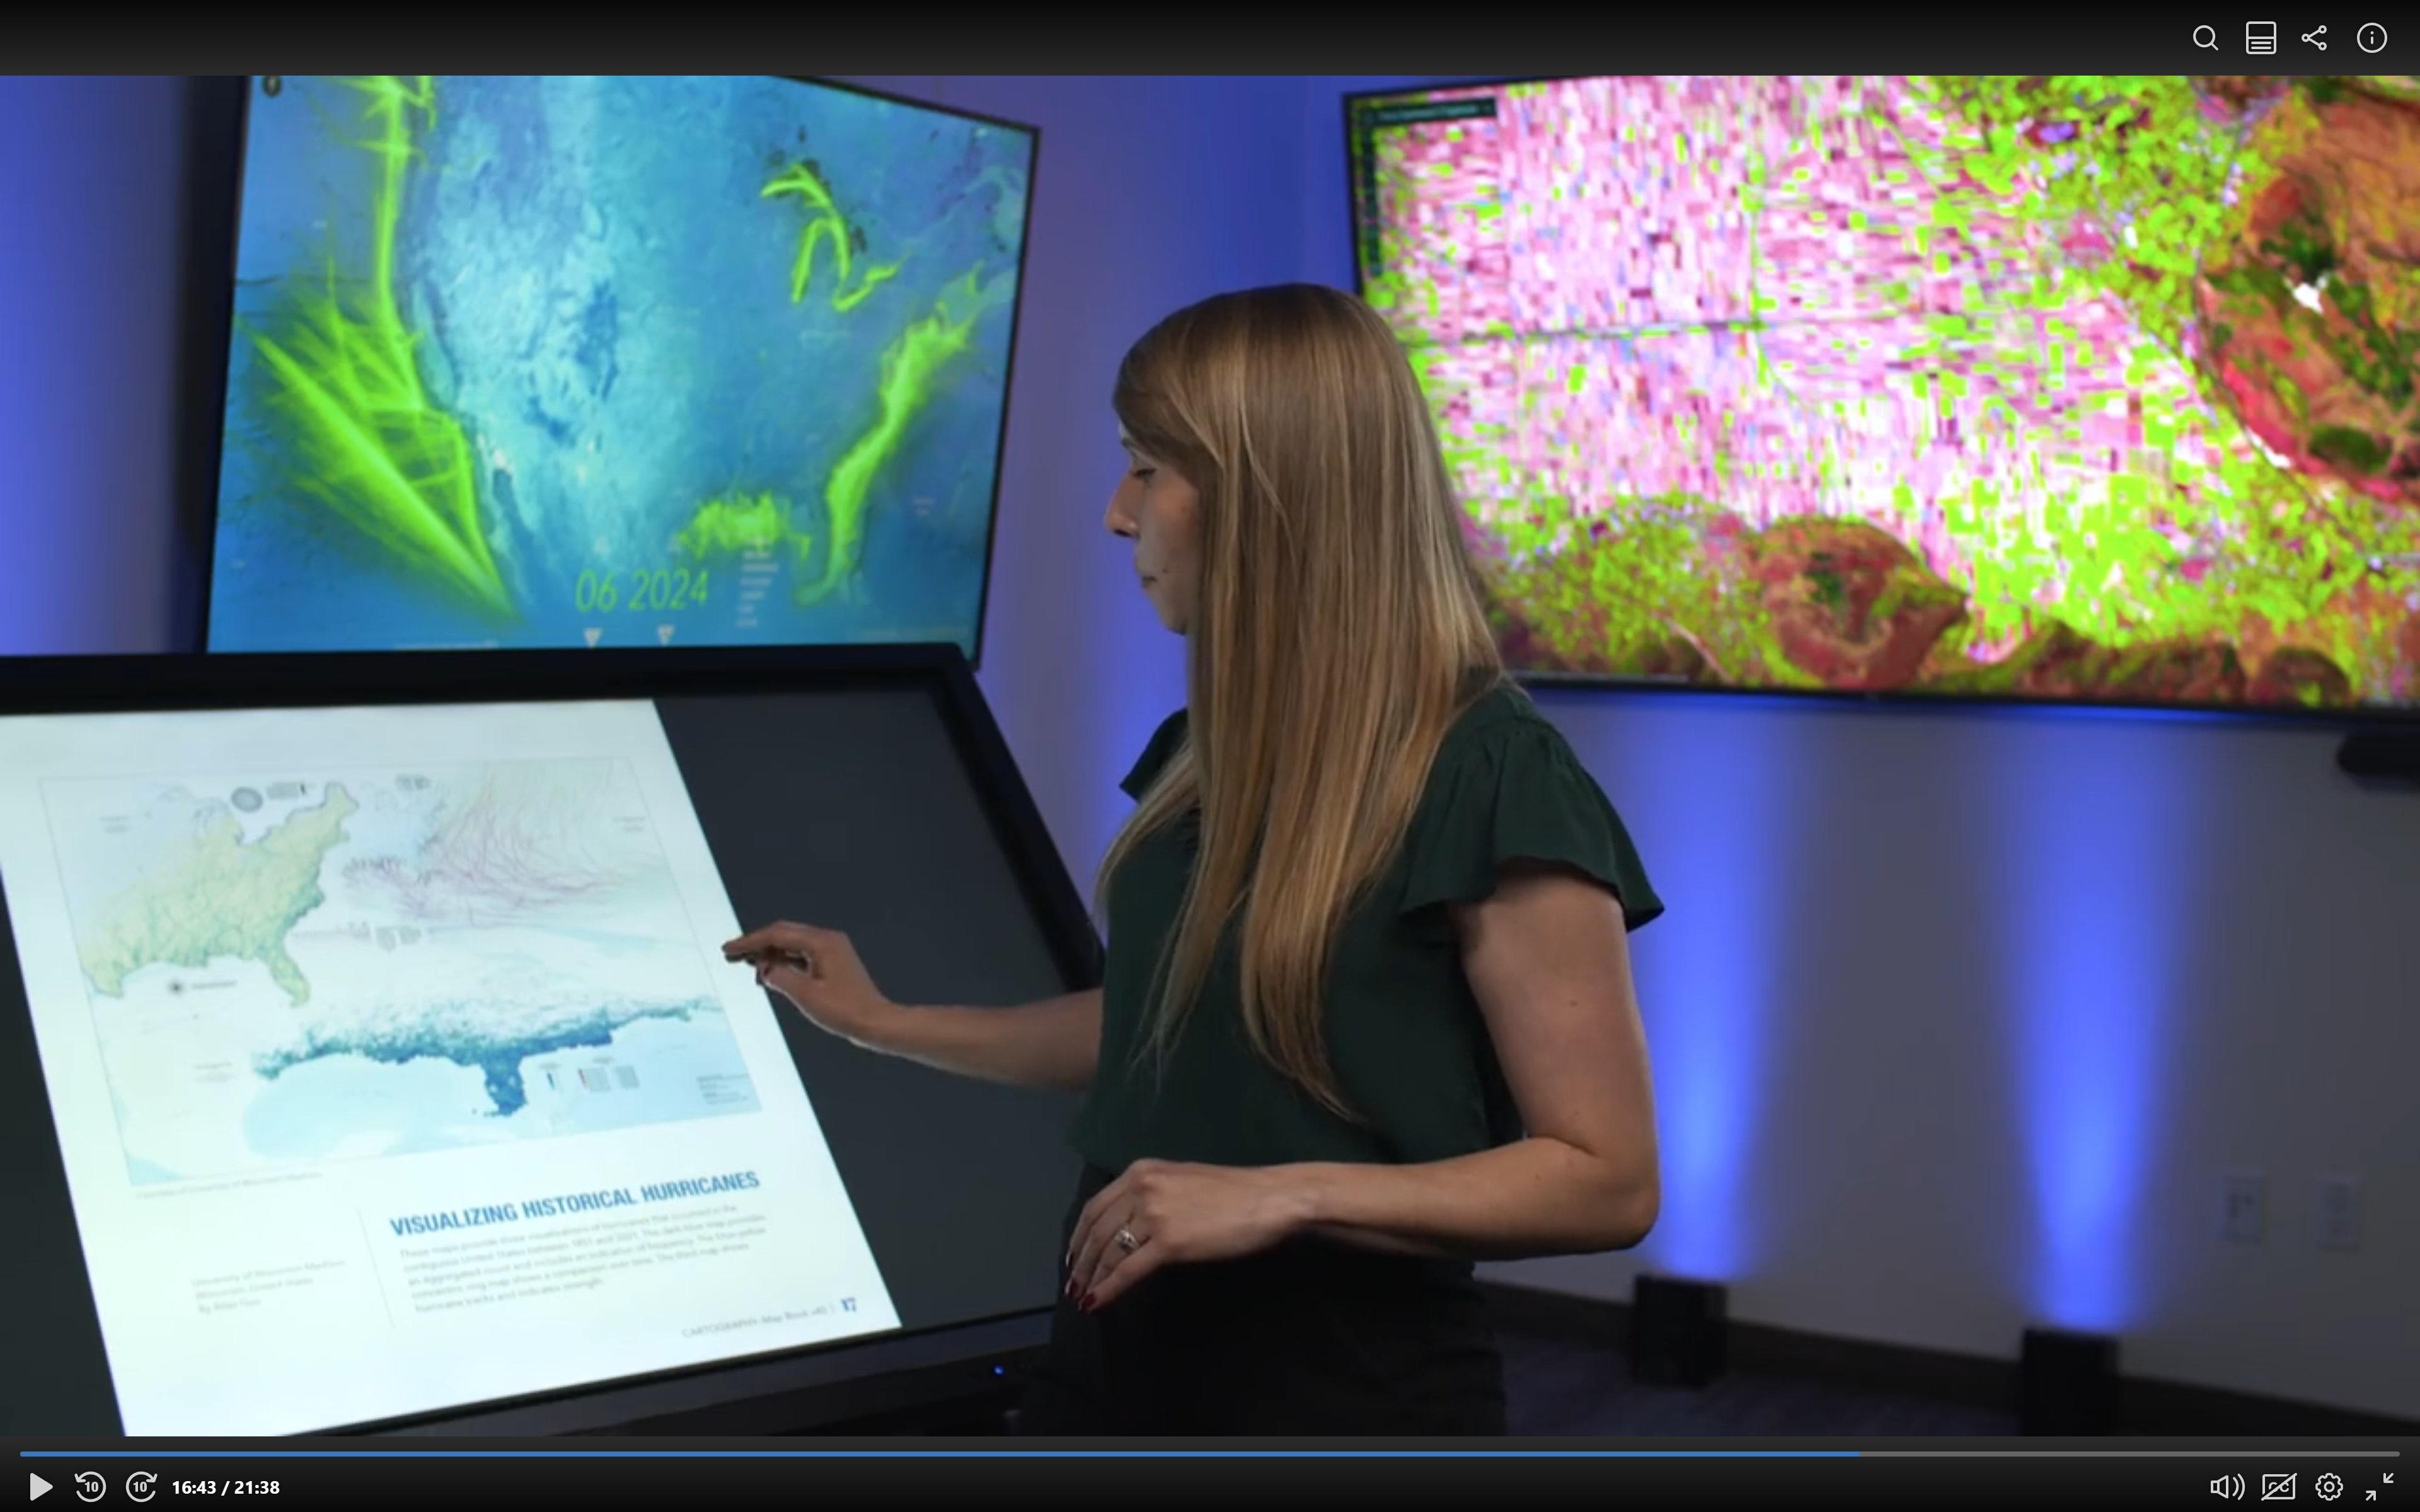
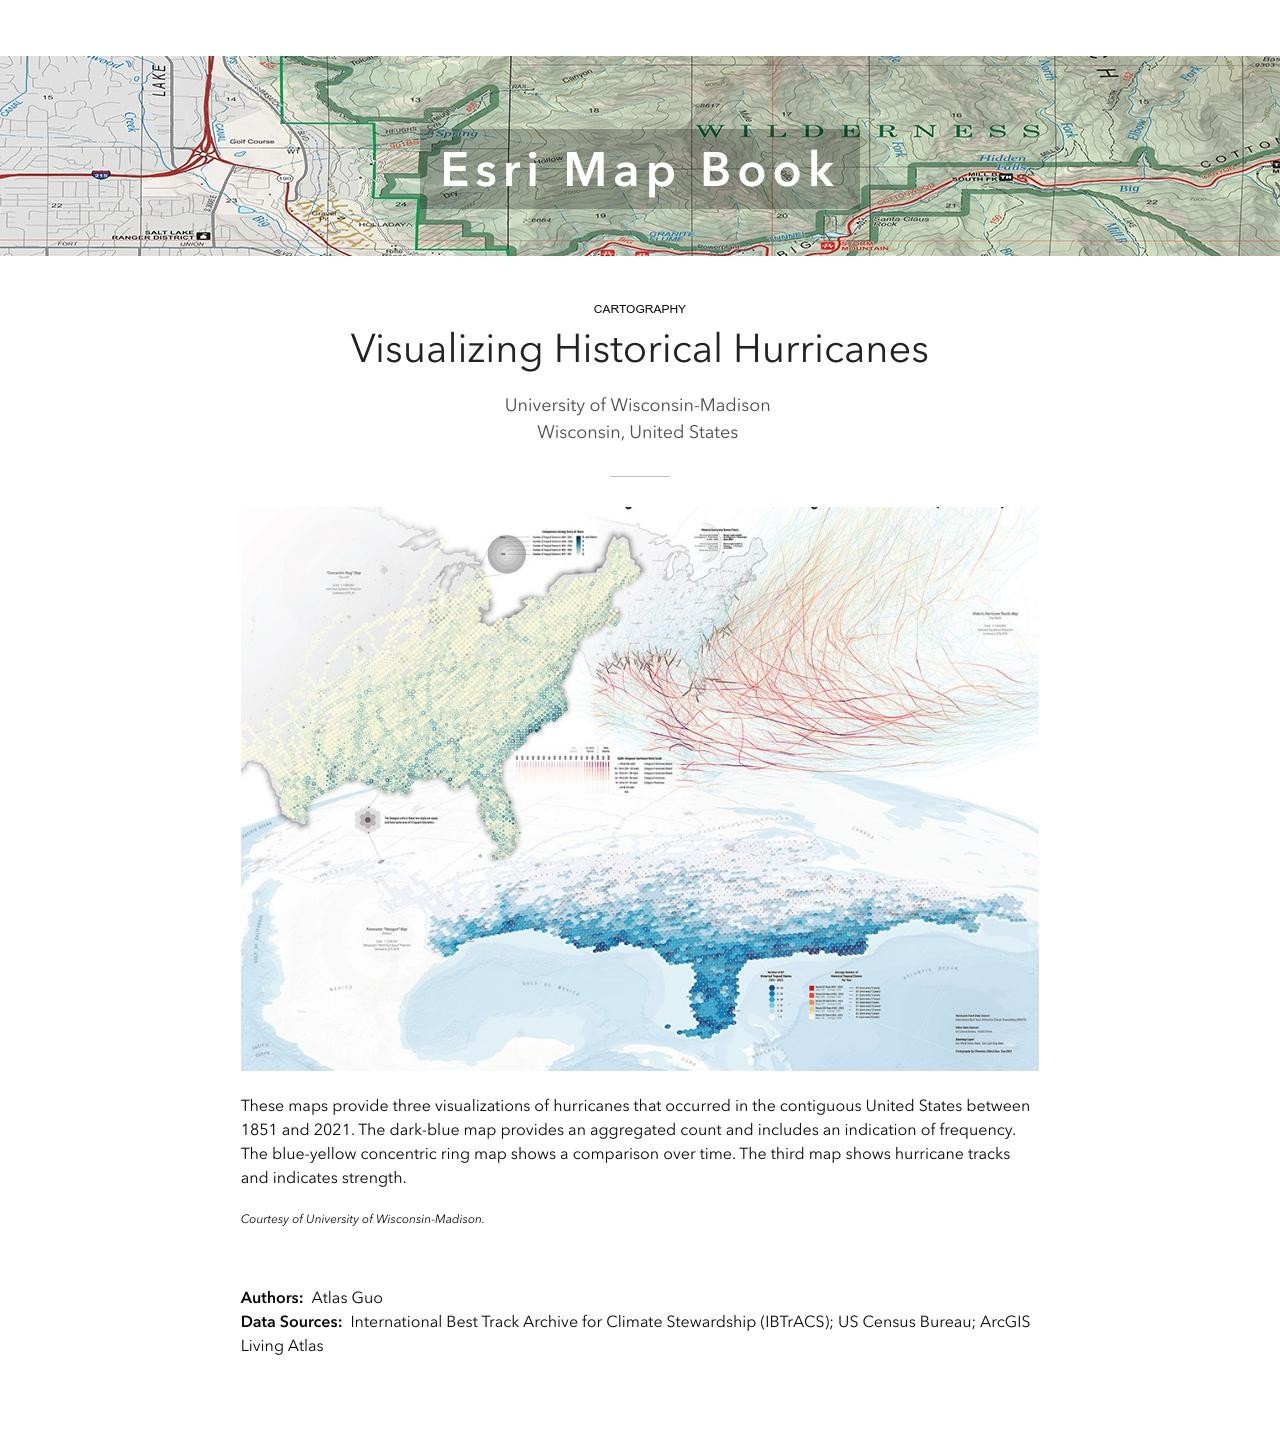
Visualizing Historical Hurricanes in Contiguous U.S.
Best Print Map in 2022 CaGIS Map Competition
 Download Compressed Image
Download Full-Size Image
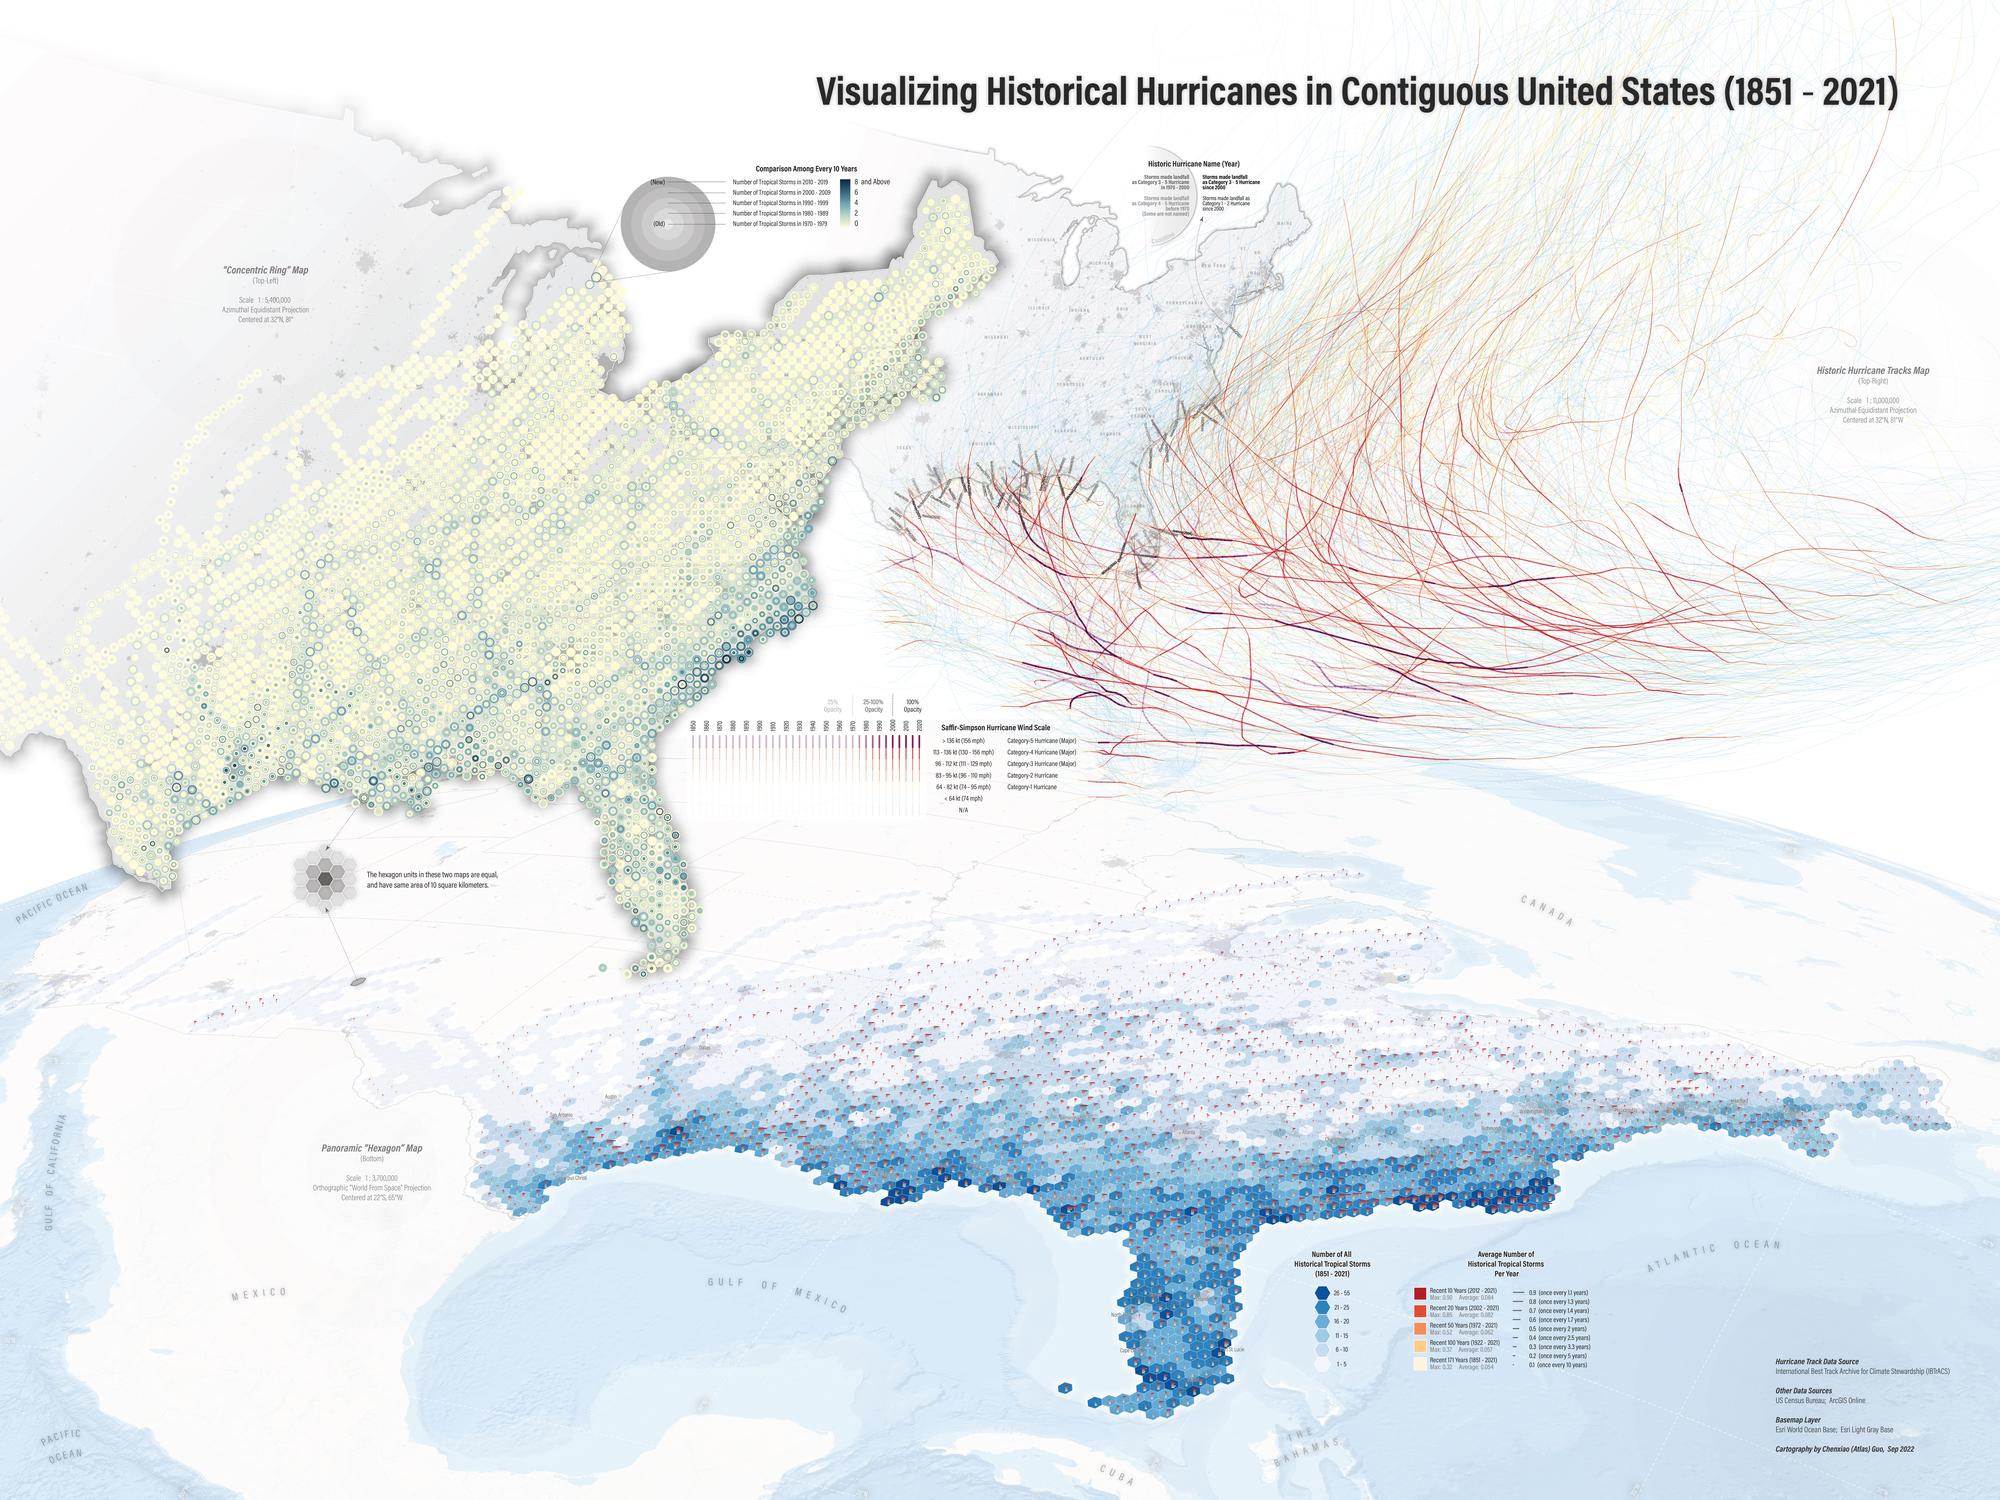
This map product is a combination of three geovisualizations about historical hurricanes in contiguous
U.S. from different perspectives.
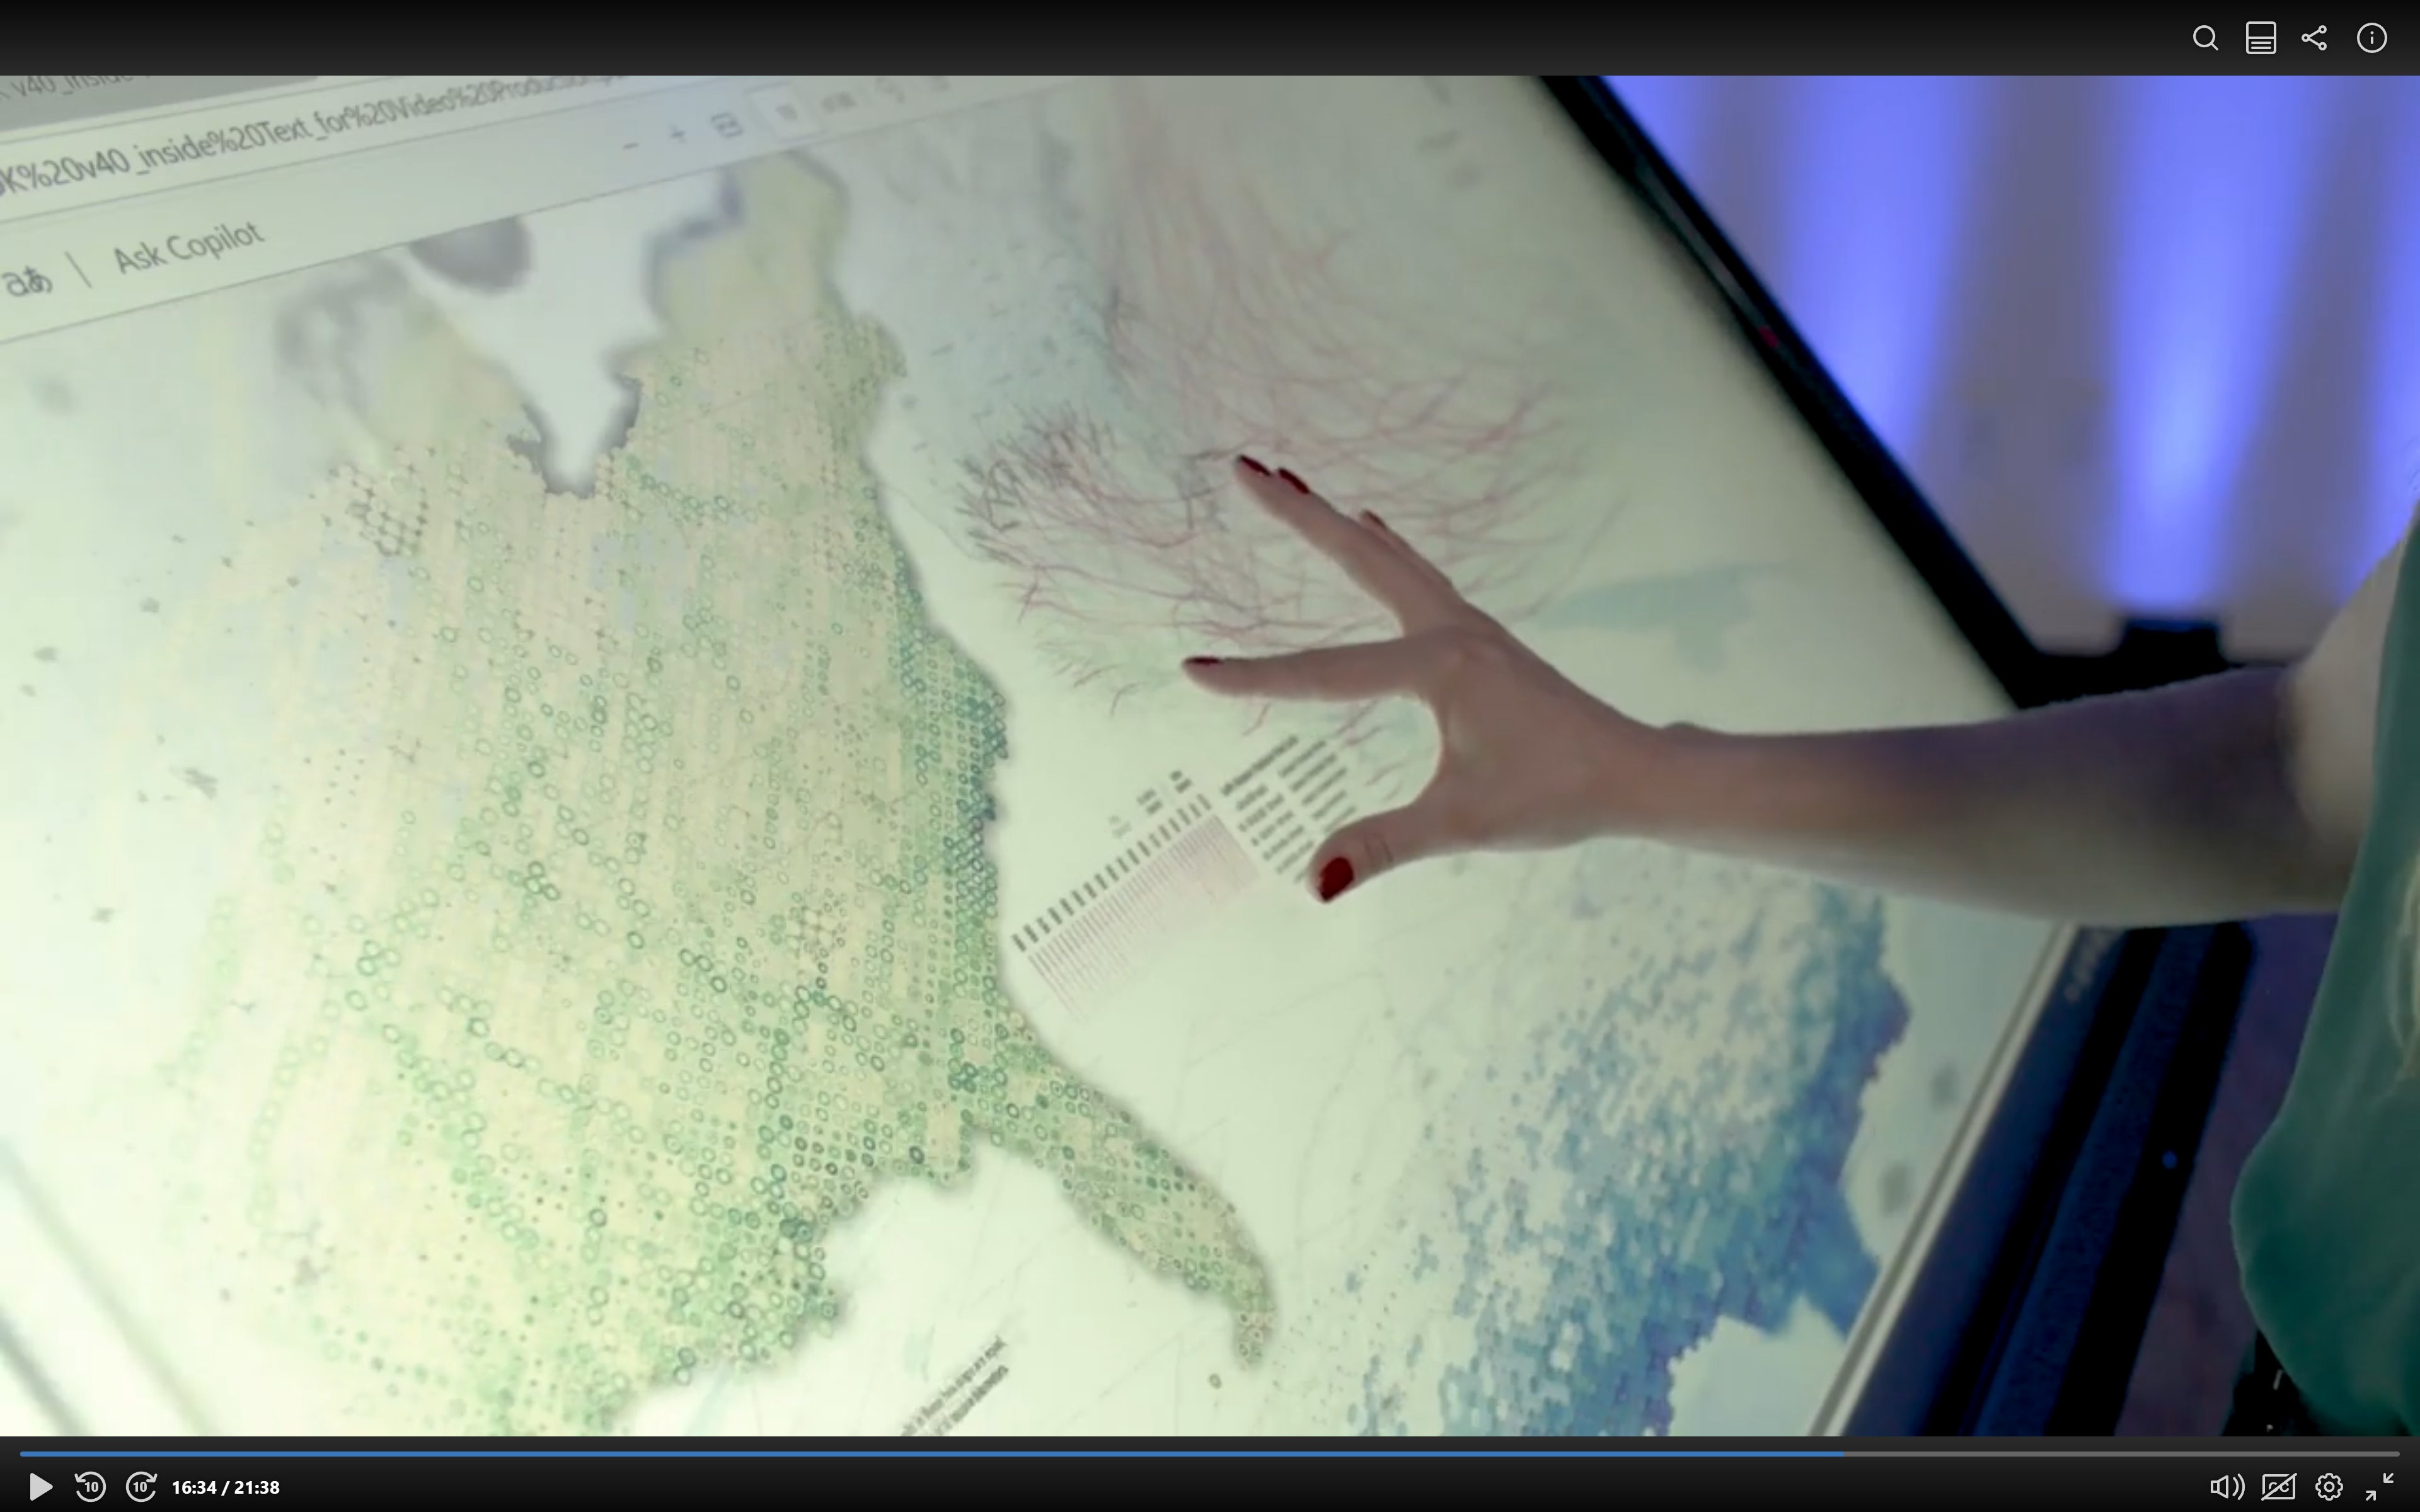
1. The Panoramic “Hexagon” Map (bottom): With orthographic “World From Space” projection, this map lines
up the major Atlantic coastal area of the U.S. horizontally. Based on
10-square-kilometer hexagon unit, the choropleth (color) shows the total number of storms, and the piled
bar chart (length) shows the storm frequencies in recent 10, 20, 50, 100, and
171 (all accessible history) years, correspondingly. Urban area is colored in light gray, and necessary
labels for major coastal cities are displayed.
2. The “Concentric Ring” Map (top-left): With same universal unit as the bottom map (10-sq-km hexagon),
this map uses concentric rings to compare the number of the storm events every
decade in recent 50 years: i.e. the center (core) indicates oldest decade (1970s) and edge ring
indicates the most recent one (2010s). The darker the ring color is, the more storms
this hexagon statistical unit has witnessed.
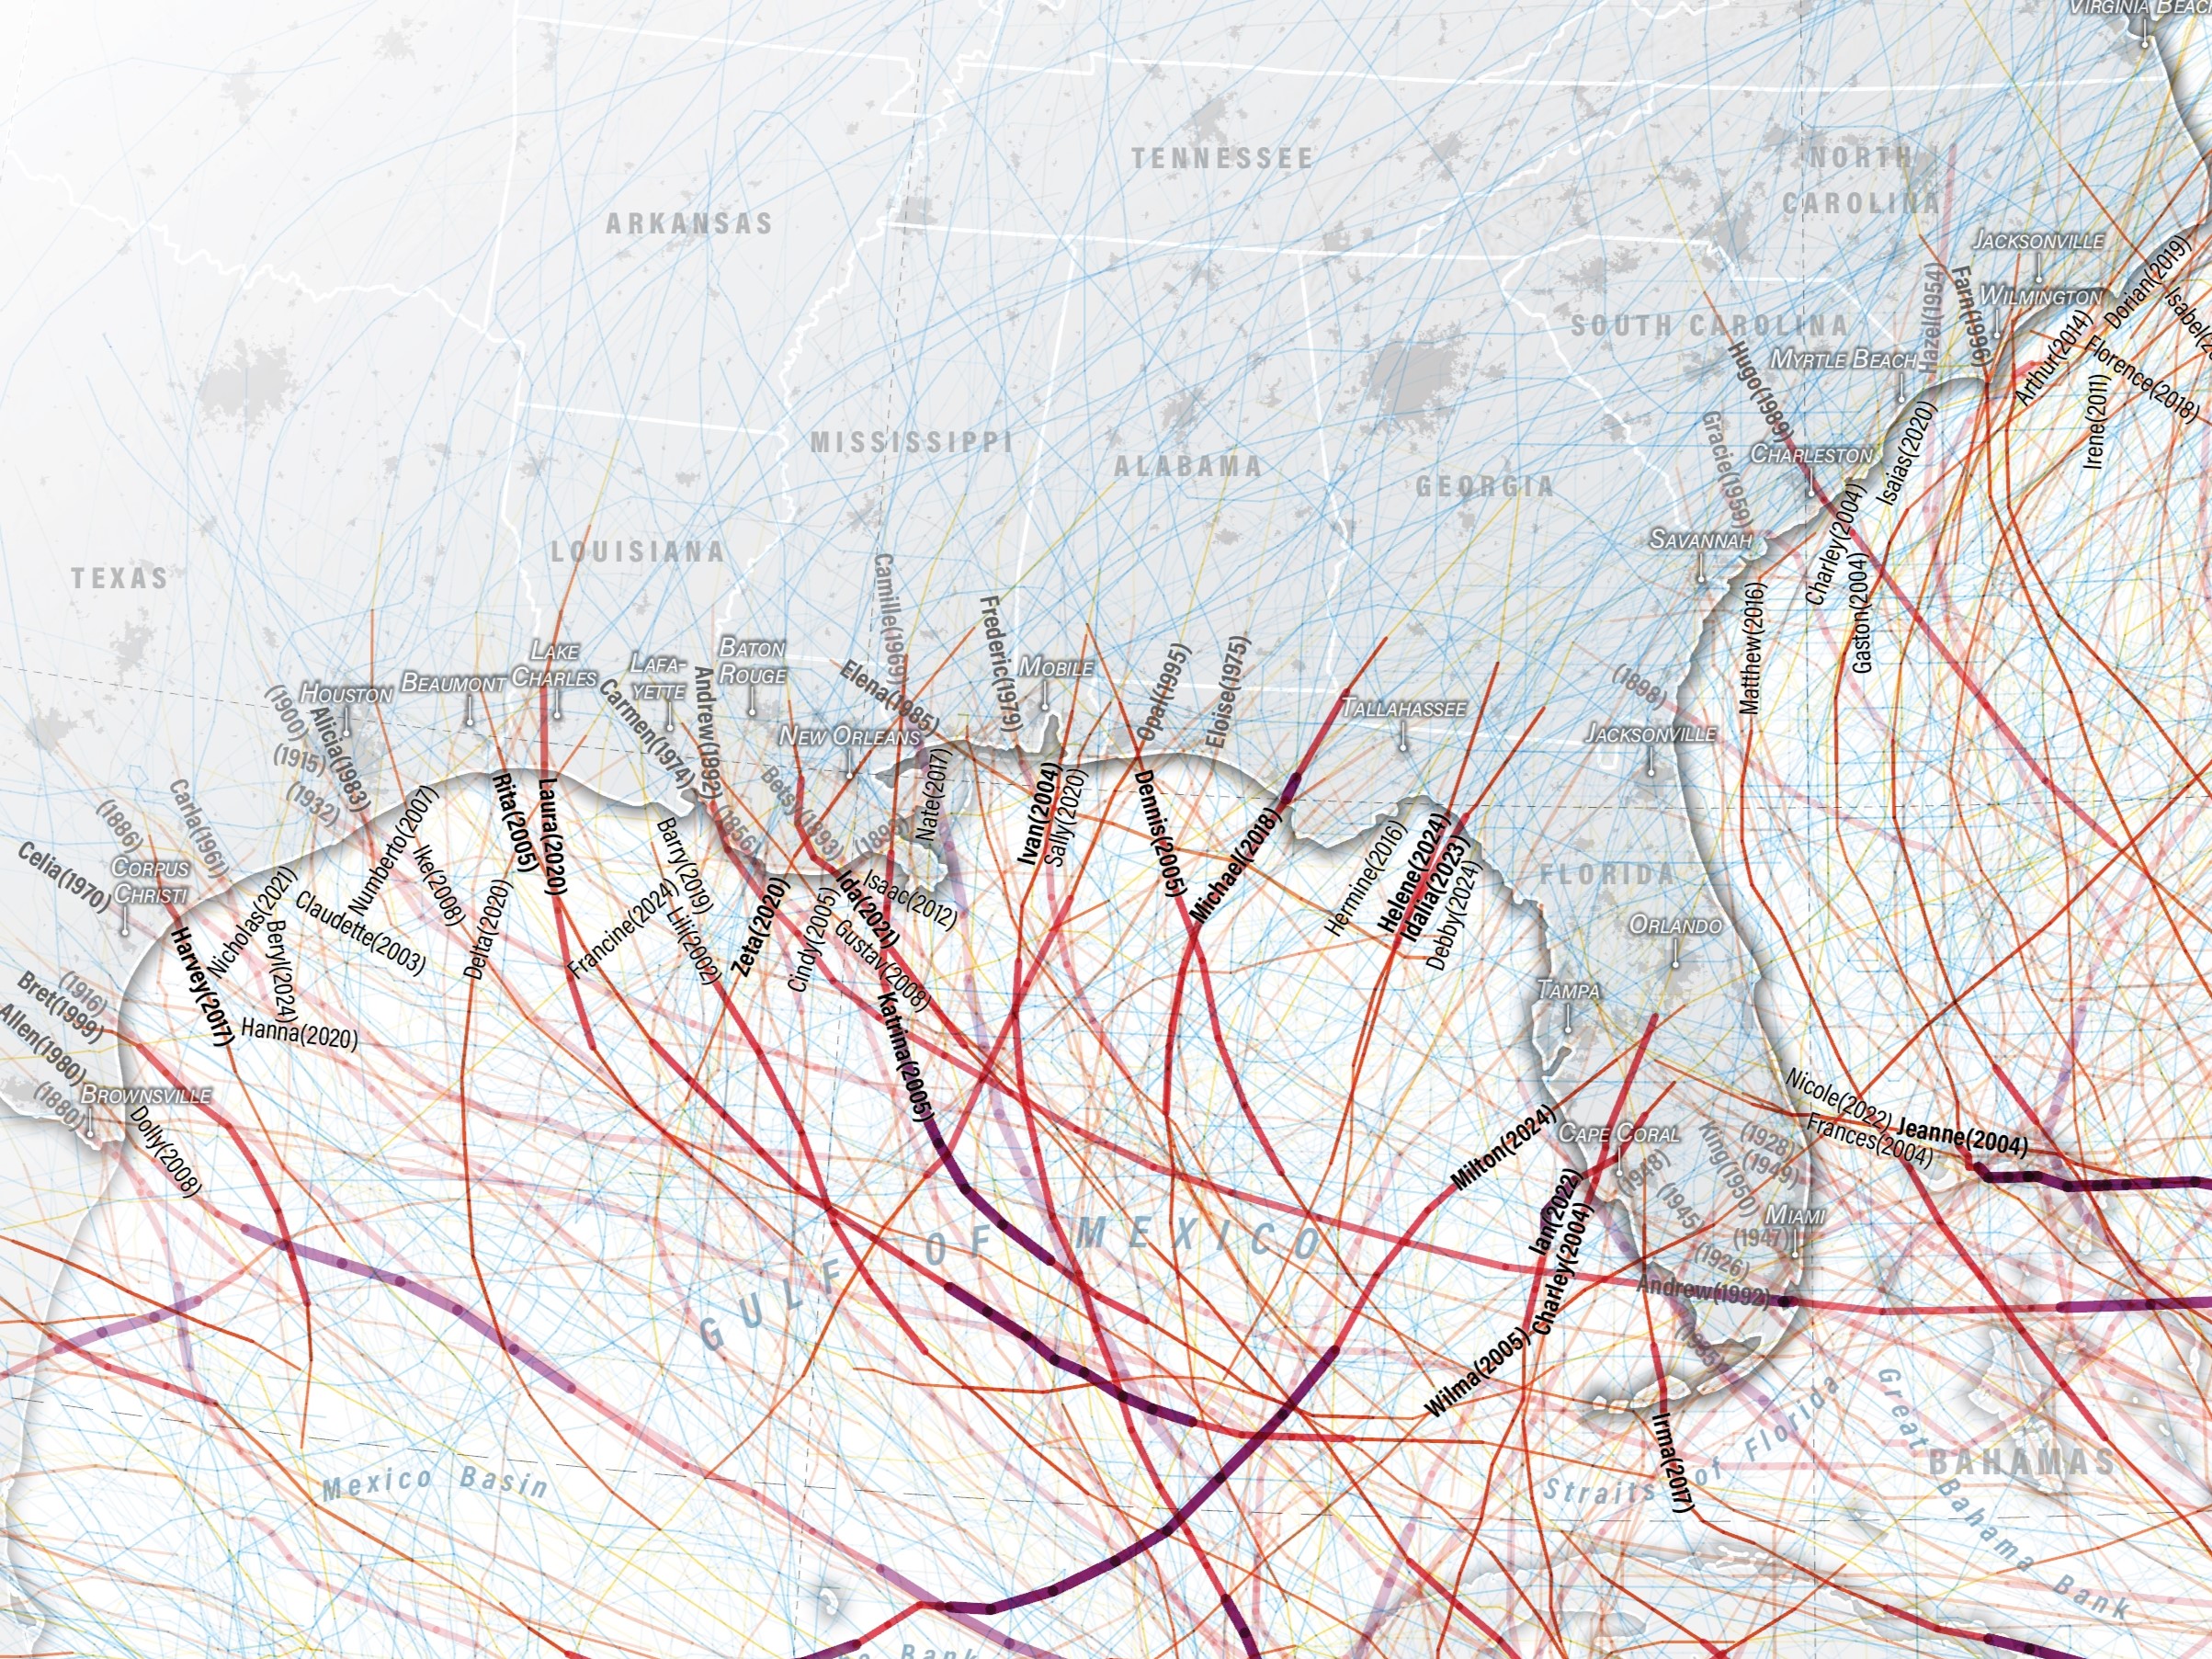
3. The “Historic Hurricane Tracks” Map (top-right): With all the hurricane tracks’ intensity displayed
in different color-width combination, the storm category (Saffir-Simpson
Hurricane Wind) is intuitively visualized at corresponding location. Storms in recent 20 years have full
opacity, and various transparency is applied according to its year, imitating
the fading out history. As for the label typography, black text indicates storms in recent 20 years,
aligned on the right side of coast; grayer text indicates storms earlier, aligned
on the left side of coast; and additionally, bold text illustrates major hurricanes (category-3 and
above). The storm’s year is added to the bracket after the name, while some
historic storms even do not have a name.
Additionally, auxiliary elements (graticule, state boundary, ocean basemap) and graphic designs
(tri-partition layout, gradient effect, drop shadow, universal condensed “Acumin”
font) are deployed for visual legibility and cartographic aesthetics.
The major data source is the International Best Track Archive for Climate Stewardship (IBTrACS) during
1851 to 2021, providing the location and intensity for global tropical
cyclones. Additional data sources include U.S. Census Bureau, ArcGIS Online, and Esri’s World Ocean
Basemap and Light Gray Basemap.
This map is the winner of Arthur Robinson Static Print Map Award in 50th CaGIS Map Design Competition.
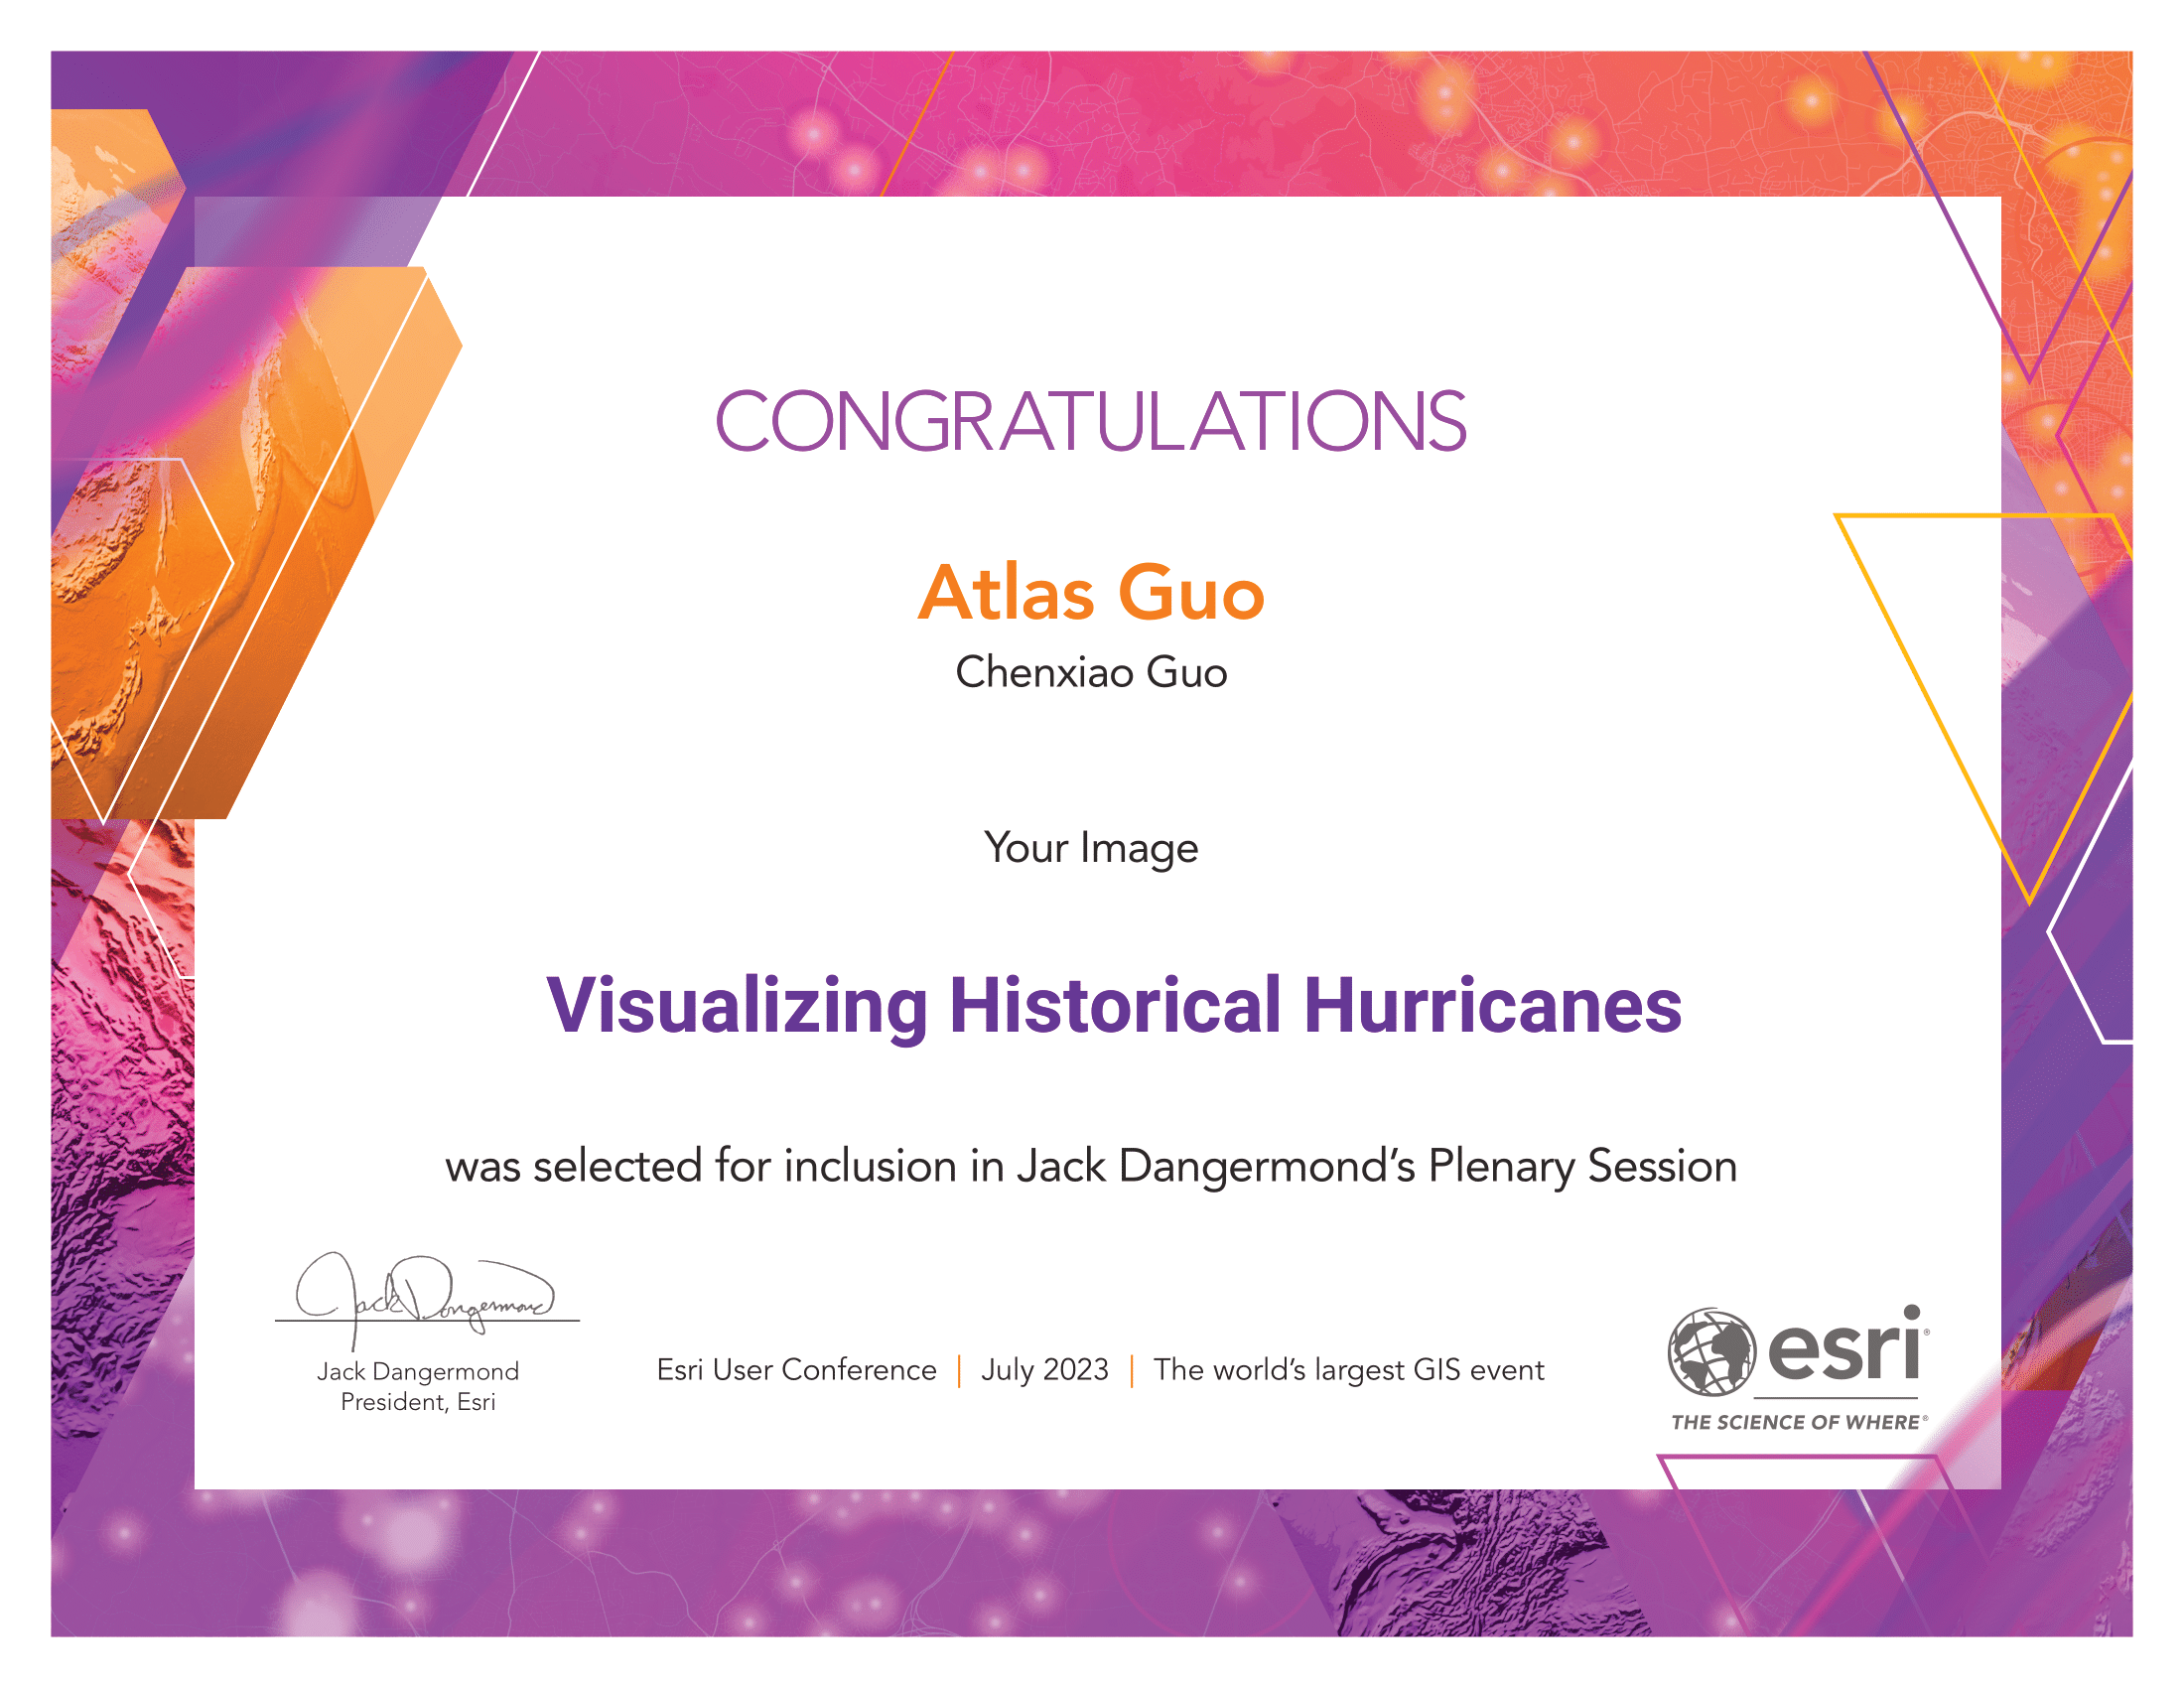
It was also personally selected by Jack Dangermond, President of Esri, to be included in the Plenary Session (about 17:22) of 2023 Esri User Conference.

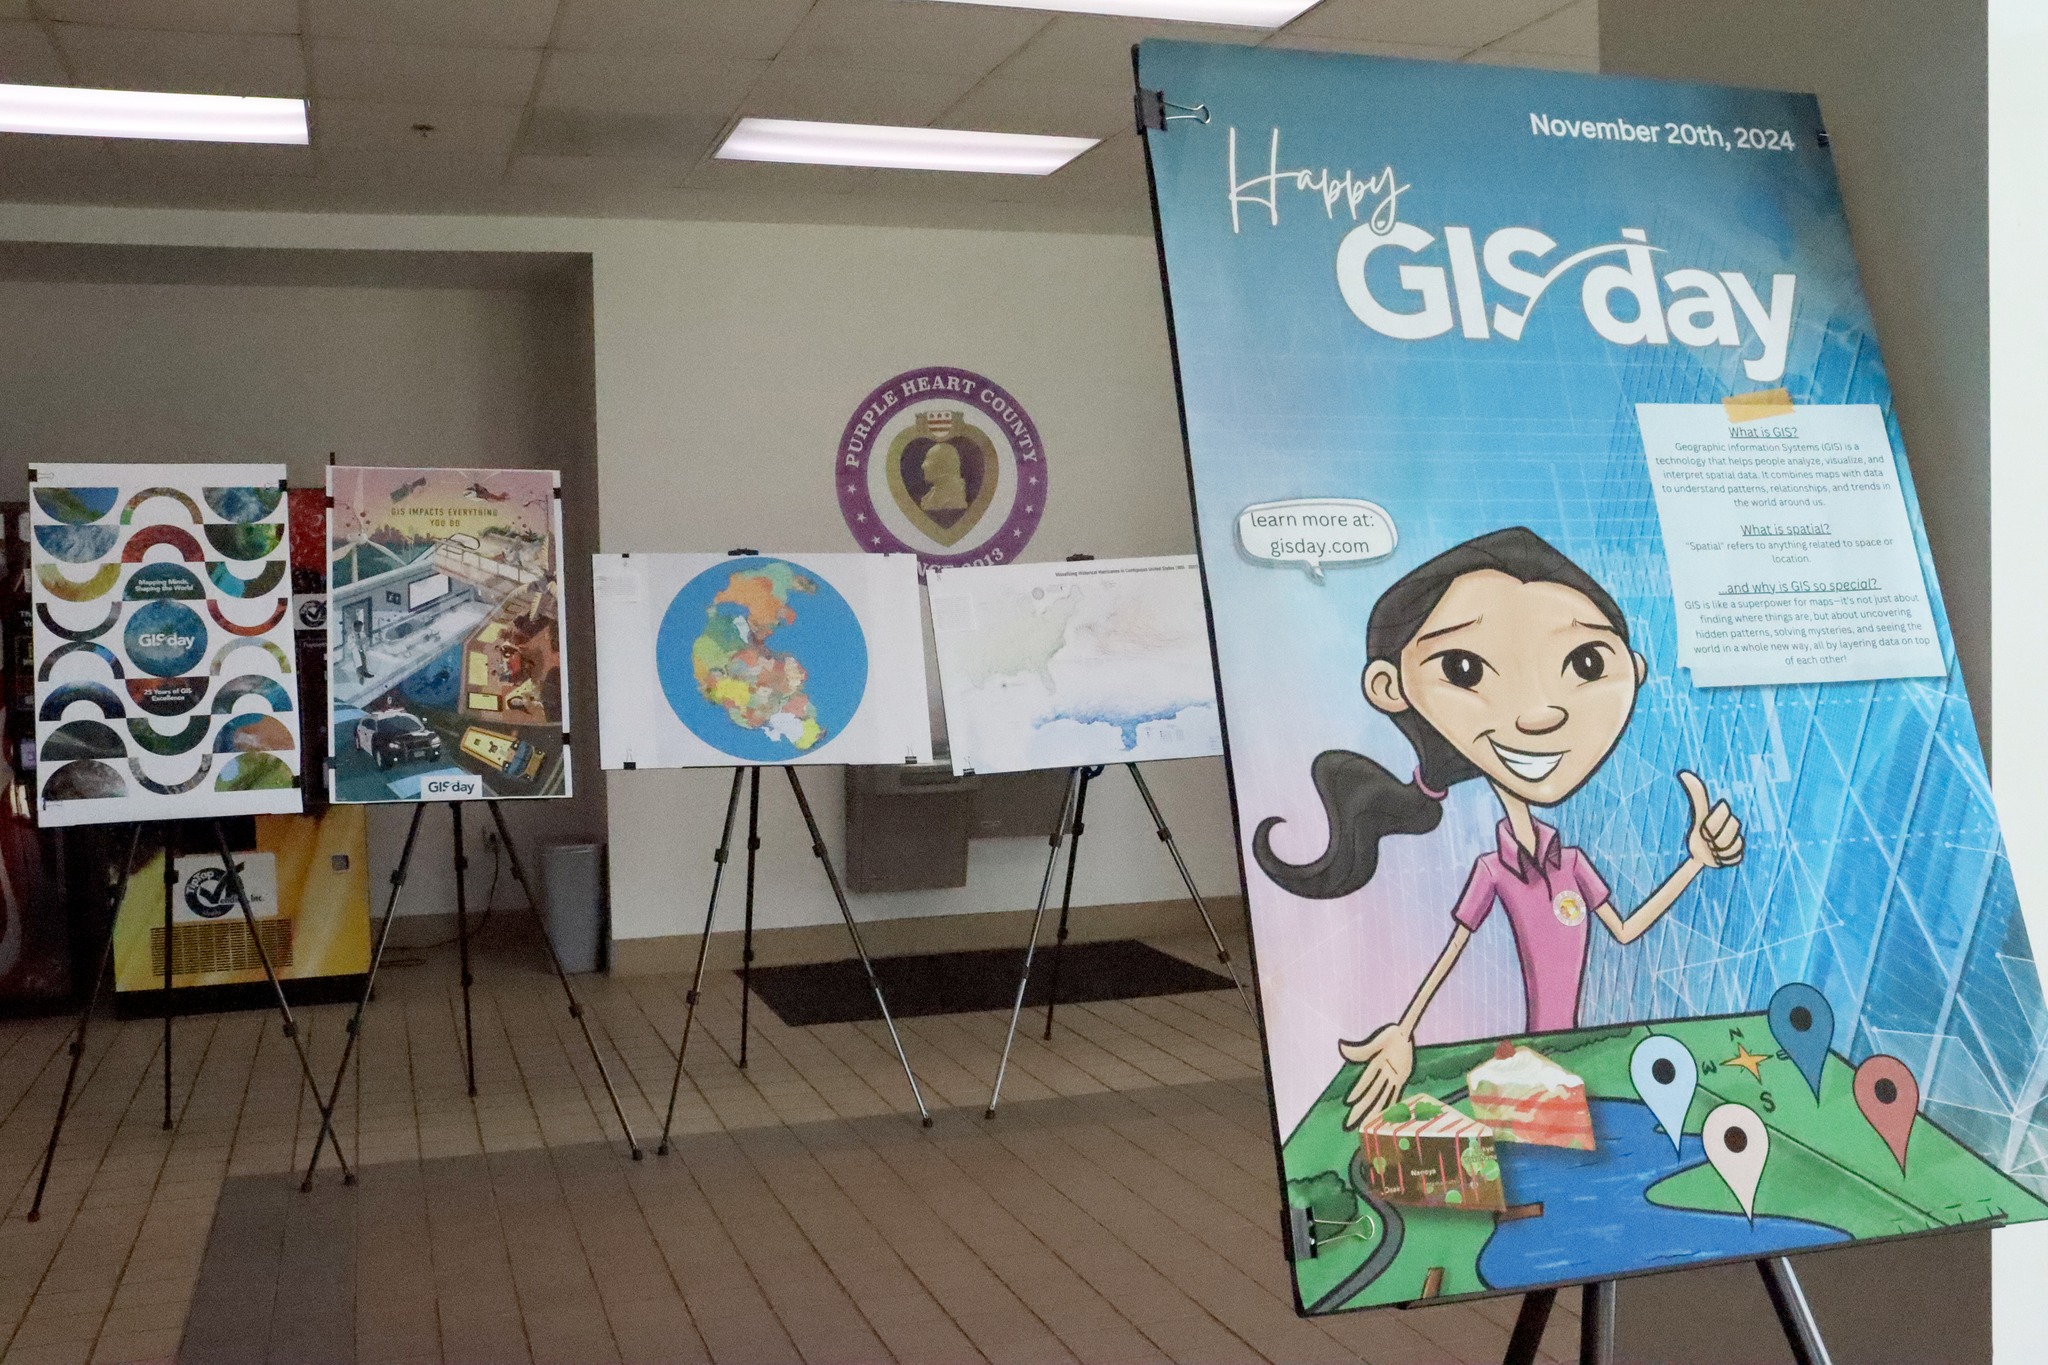
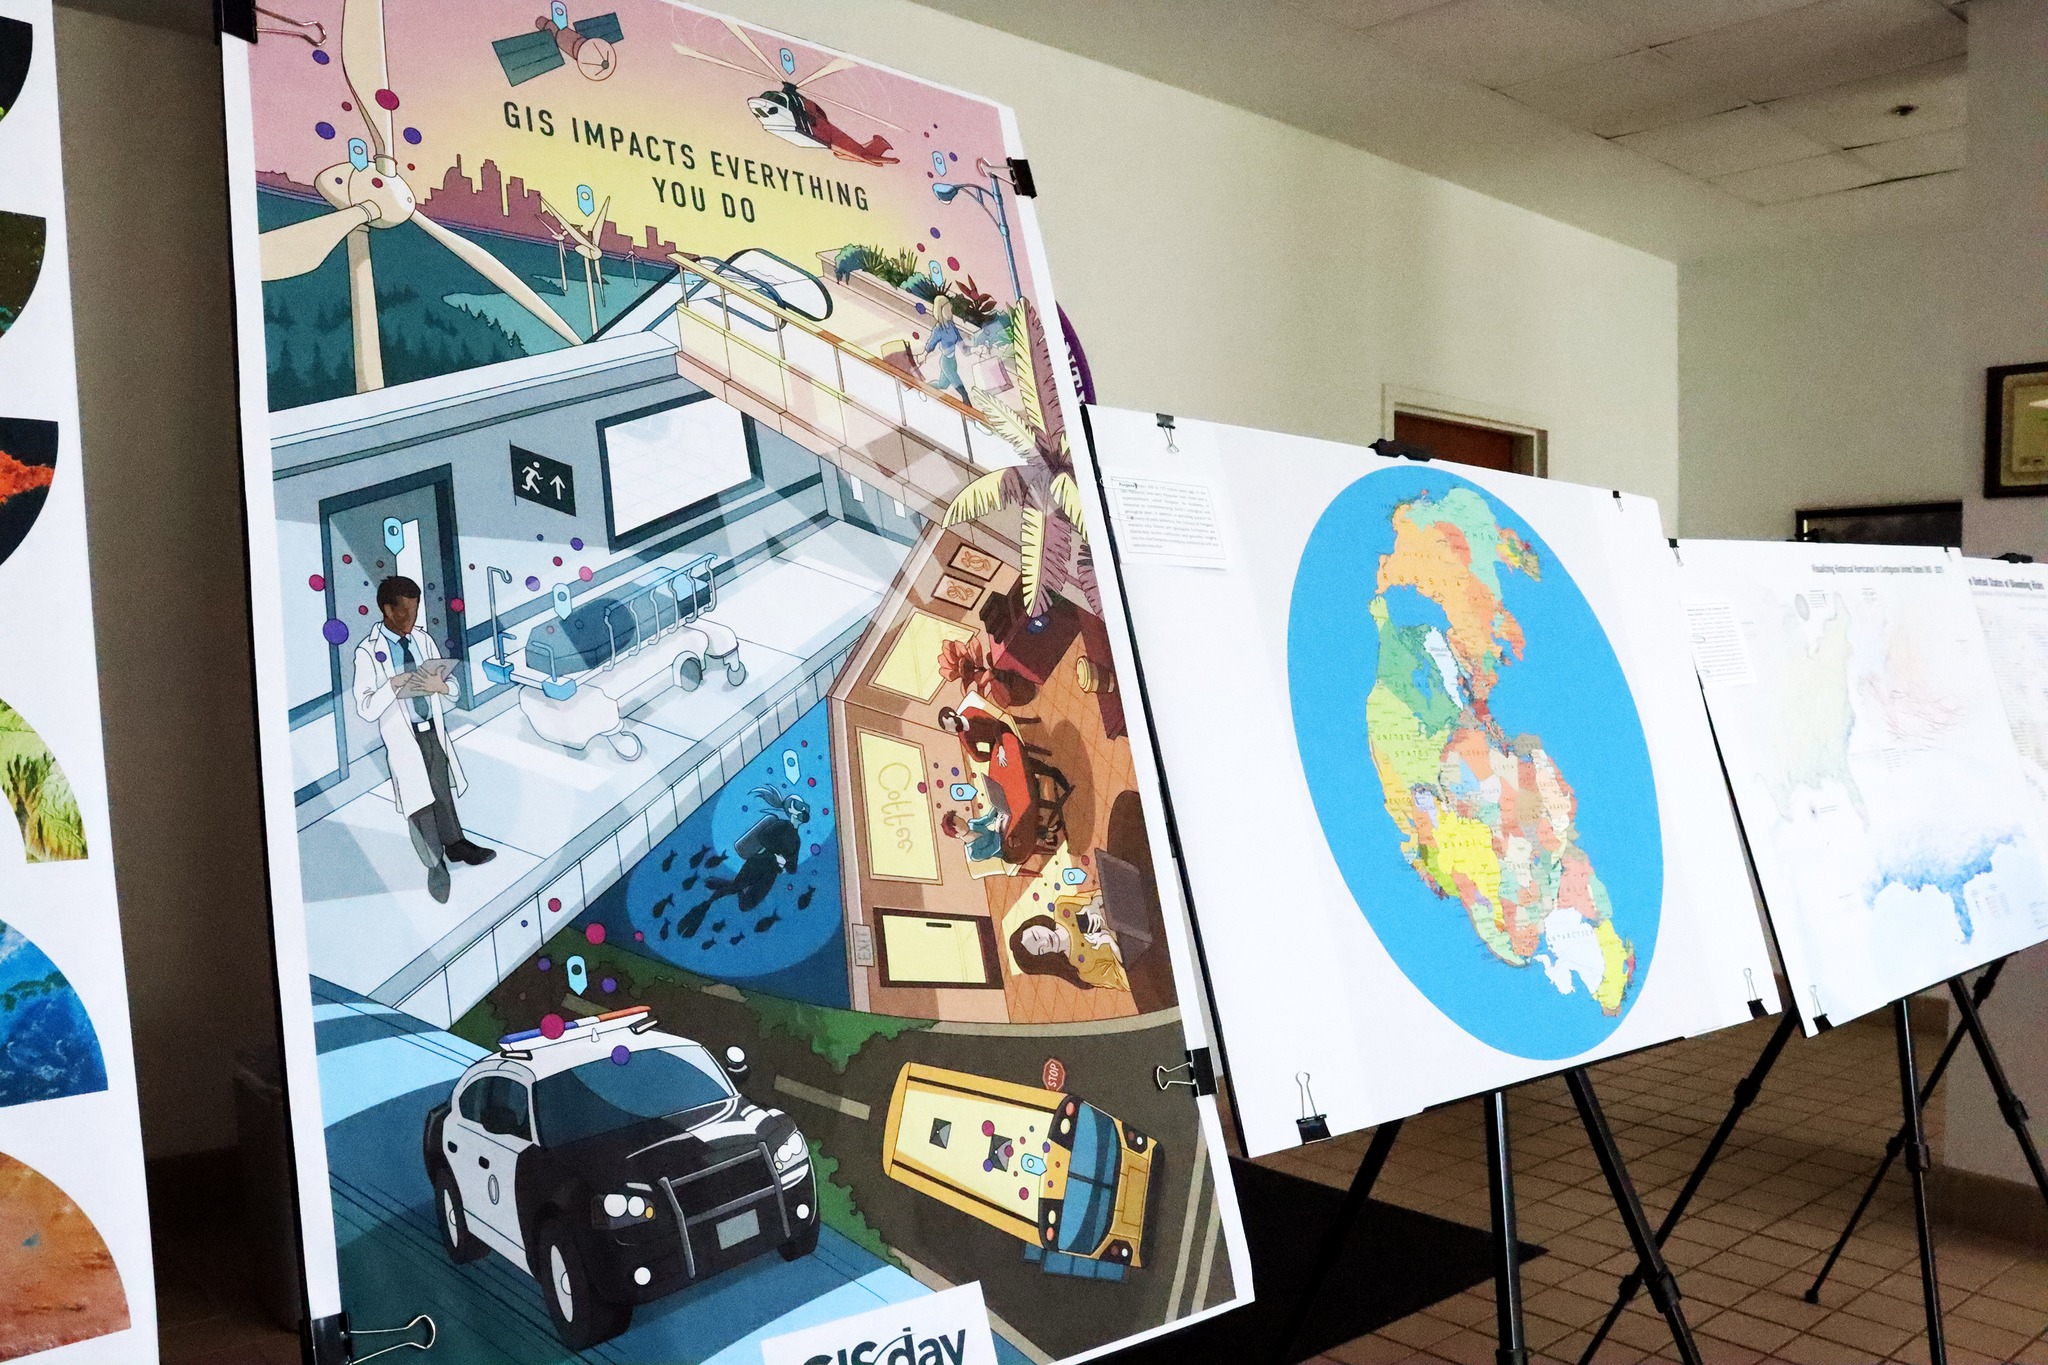
This map was selected by the Highlands County (FL) Board of County Commissioners, to be featured in the traveling "Map Expo" for public educational purpose. The exhibition was firstly on display in the government building for GIS Day, and then moved to 3 public libraries till mid-December.
Dates & Locations of "2024 Map Expo":
1. Government Center lobby, Nov. 18-22, 2024
(600 S. Commerce Ave., Sebring)
2. Avon Park Public Library, Nov. 25-27, 2024
(100 N. Museum Ave., Avon Park)
3. Sebring Public Library, Dec. 2-8, 2024
(319 W. Center Ave., Sebring)
4. Lake Placid Memorial Library, Dec. 10-15, 2024
(205 W. Interlake Blvd., Lake Placid)


This map is published on Vol.40 of Esri Map Book in 2025, and was featured in Esri 2025 User Conference's Mappy Hour Session.

Interested in viewing am up-to-date version of the tracks? I've made it a seperate map: Historical Hurricane Tracks in Contiguous United States.