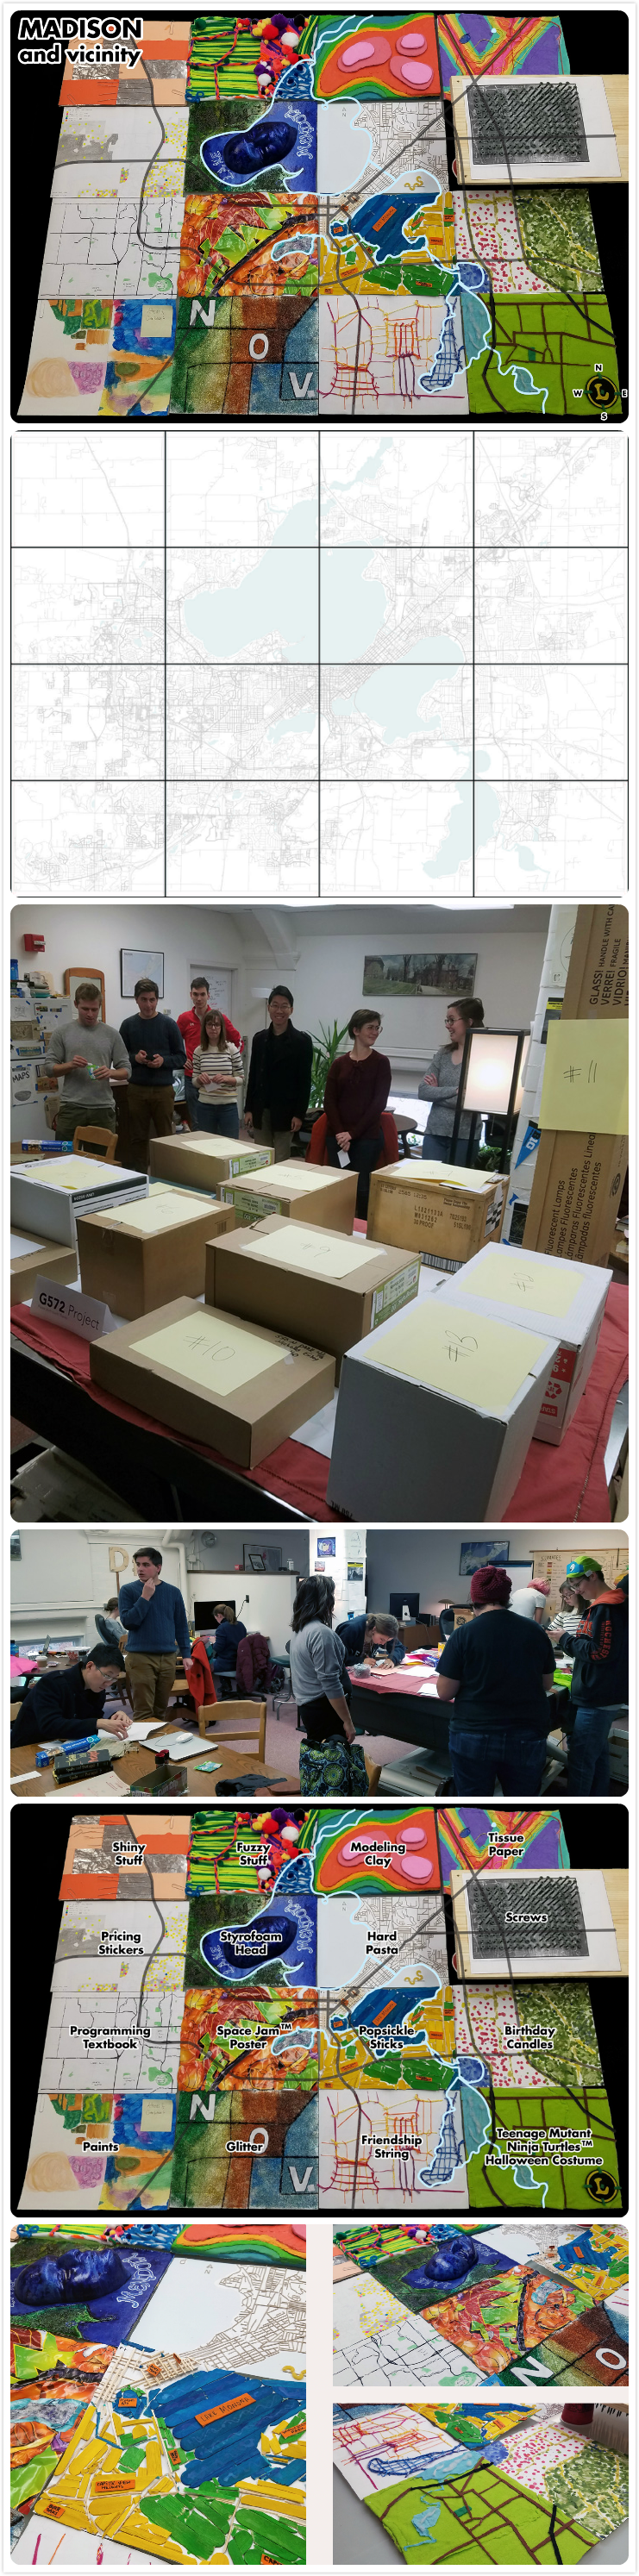
"Madison and Vicinity" Quilt
Contributing categorical dot density map using pricing stickers for a tangible Map Quilt Challenge project
 Download Combined Long Image
This is a collaborative project during the course of Graphic Design in Cartography, during which each
participant is randomly assigned a blank map as well as given materials that
should be mainly used. The map piece assigned to me is the Middle downtown area, to be filled with
pricing stickers. I made a categorical dot density map where dots of specific color
represent the same population of specific racial groups. In addition, I draw a pencil choropleth as the
base map showing the overall population density.
Click
to view the published paper at Cartographic Perspectives.