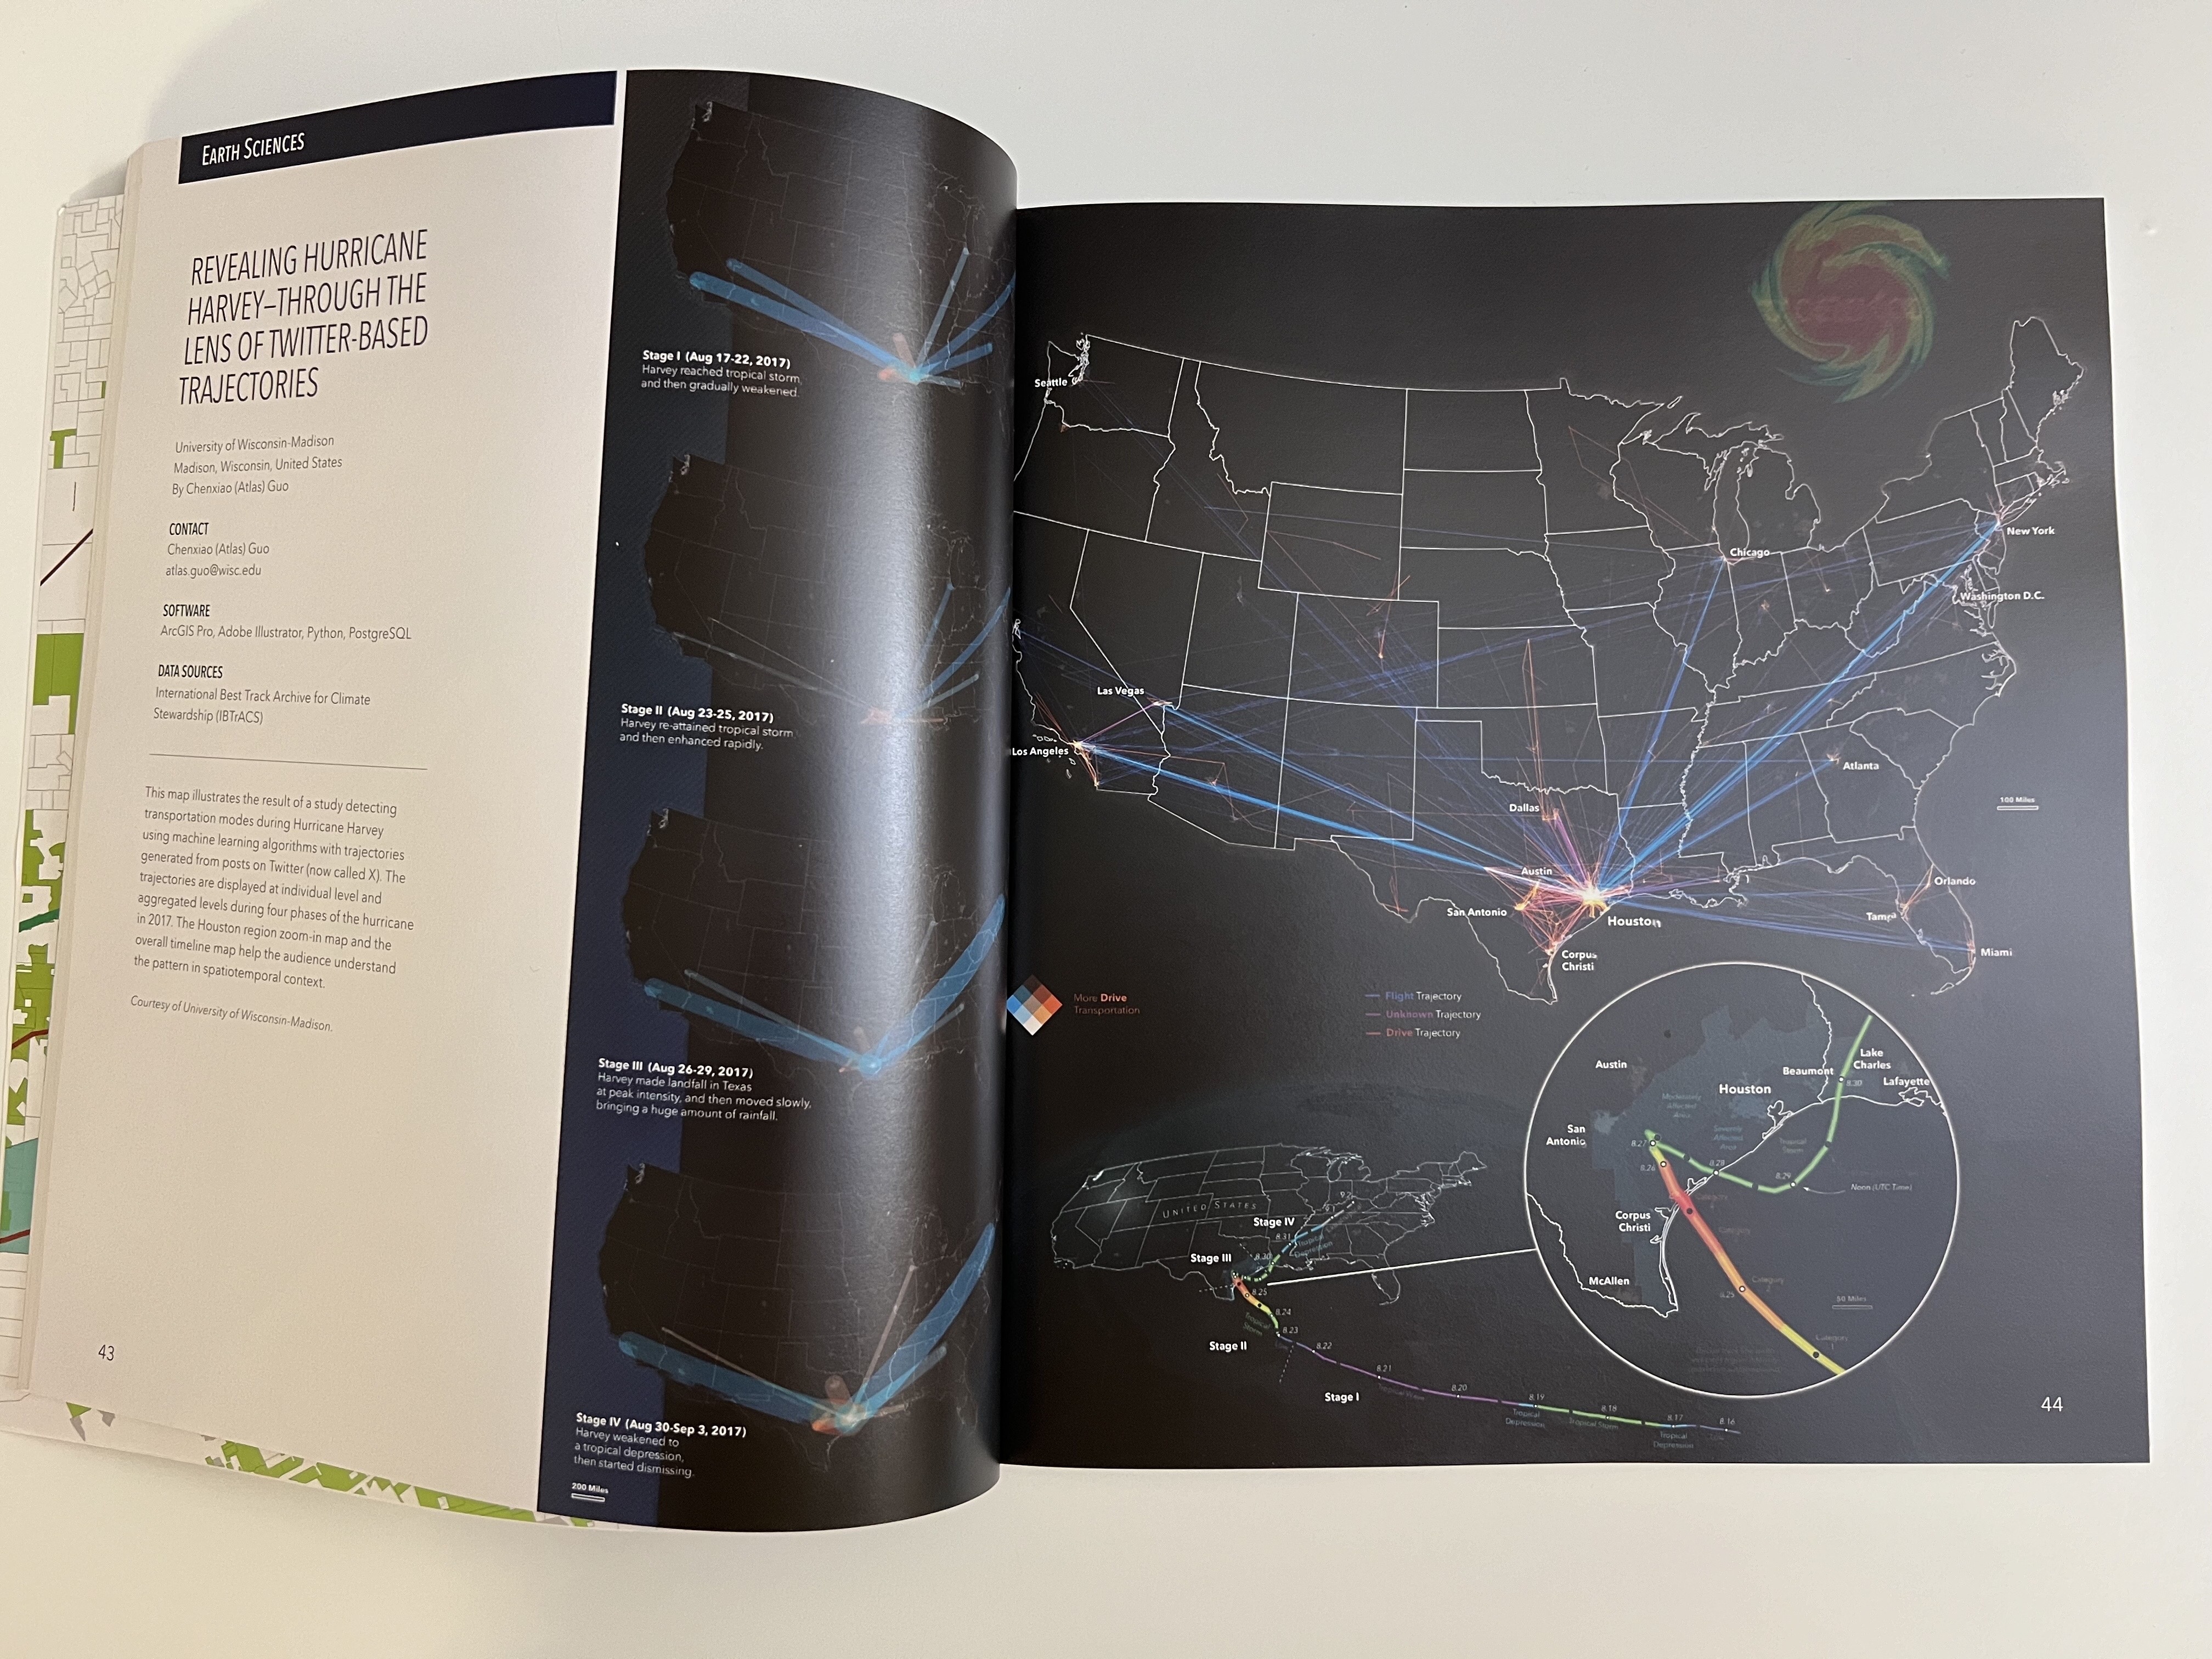
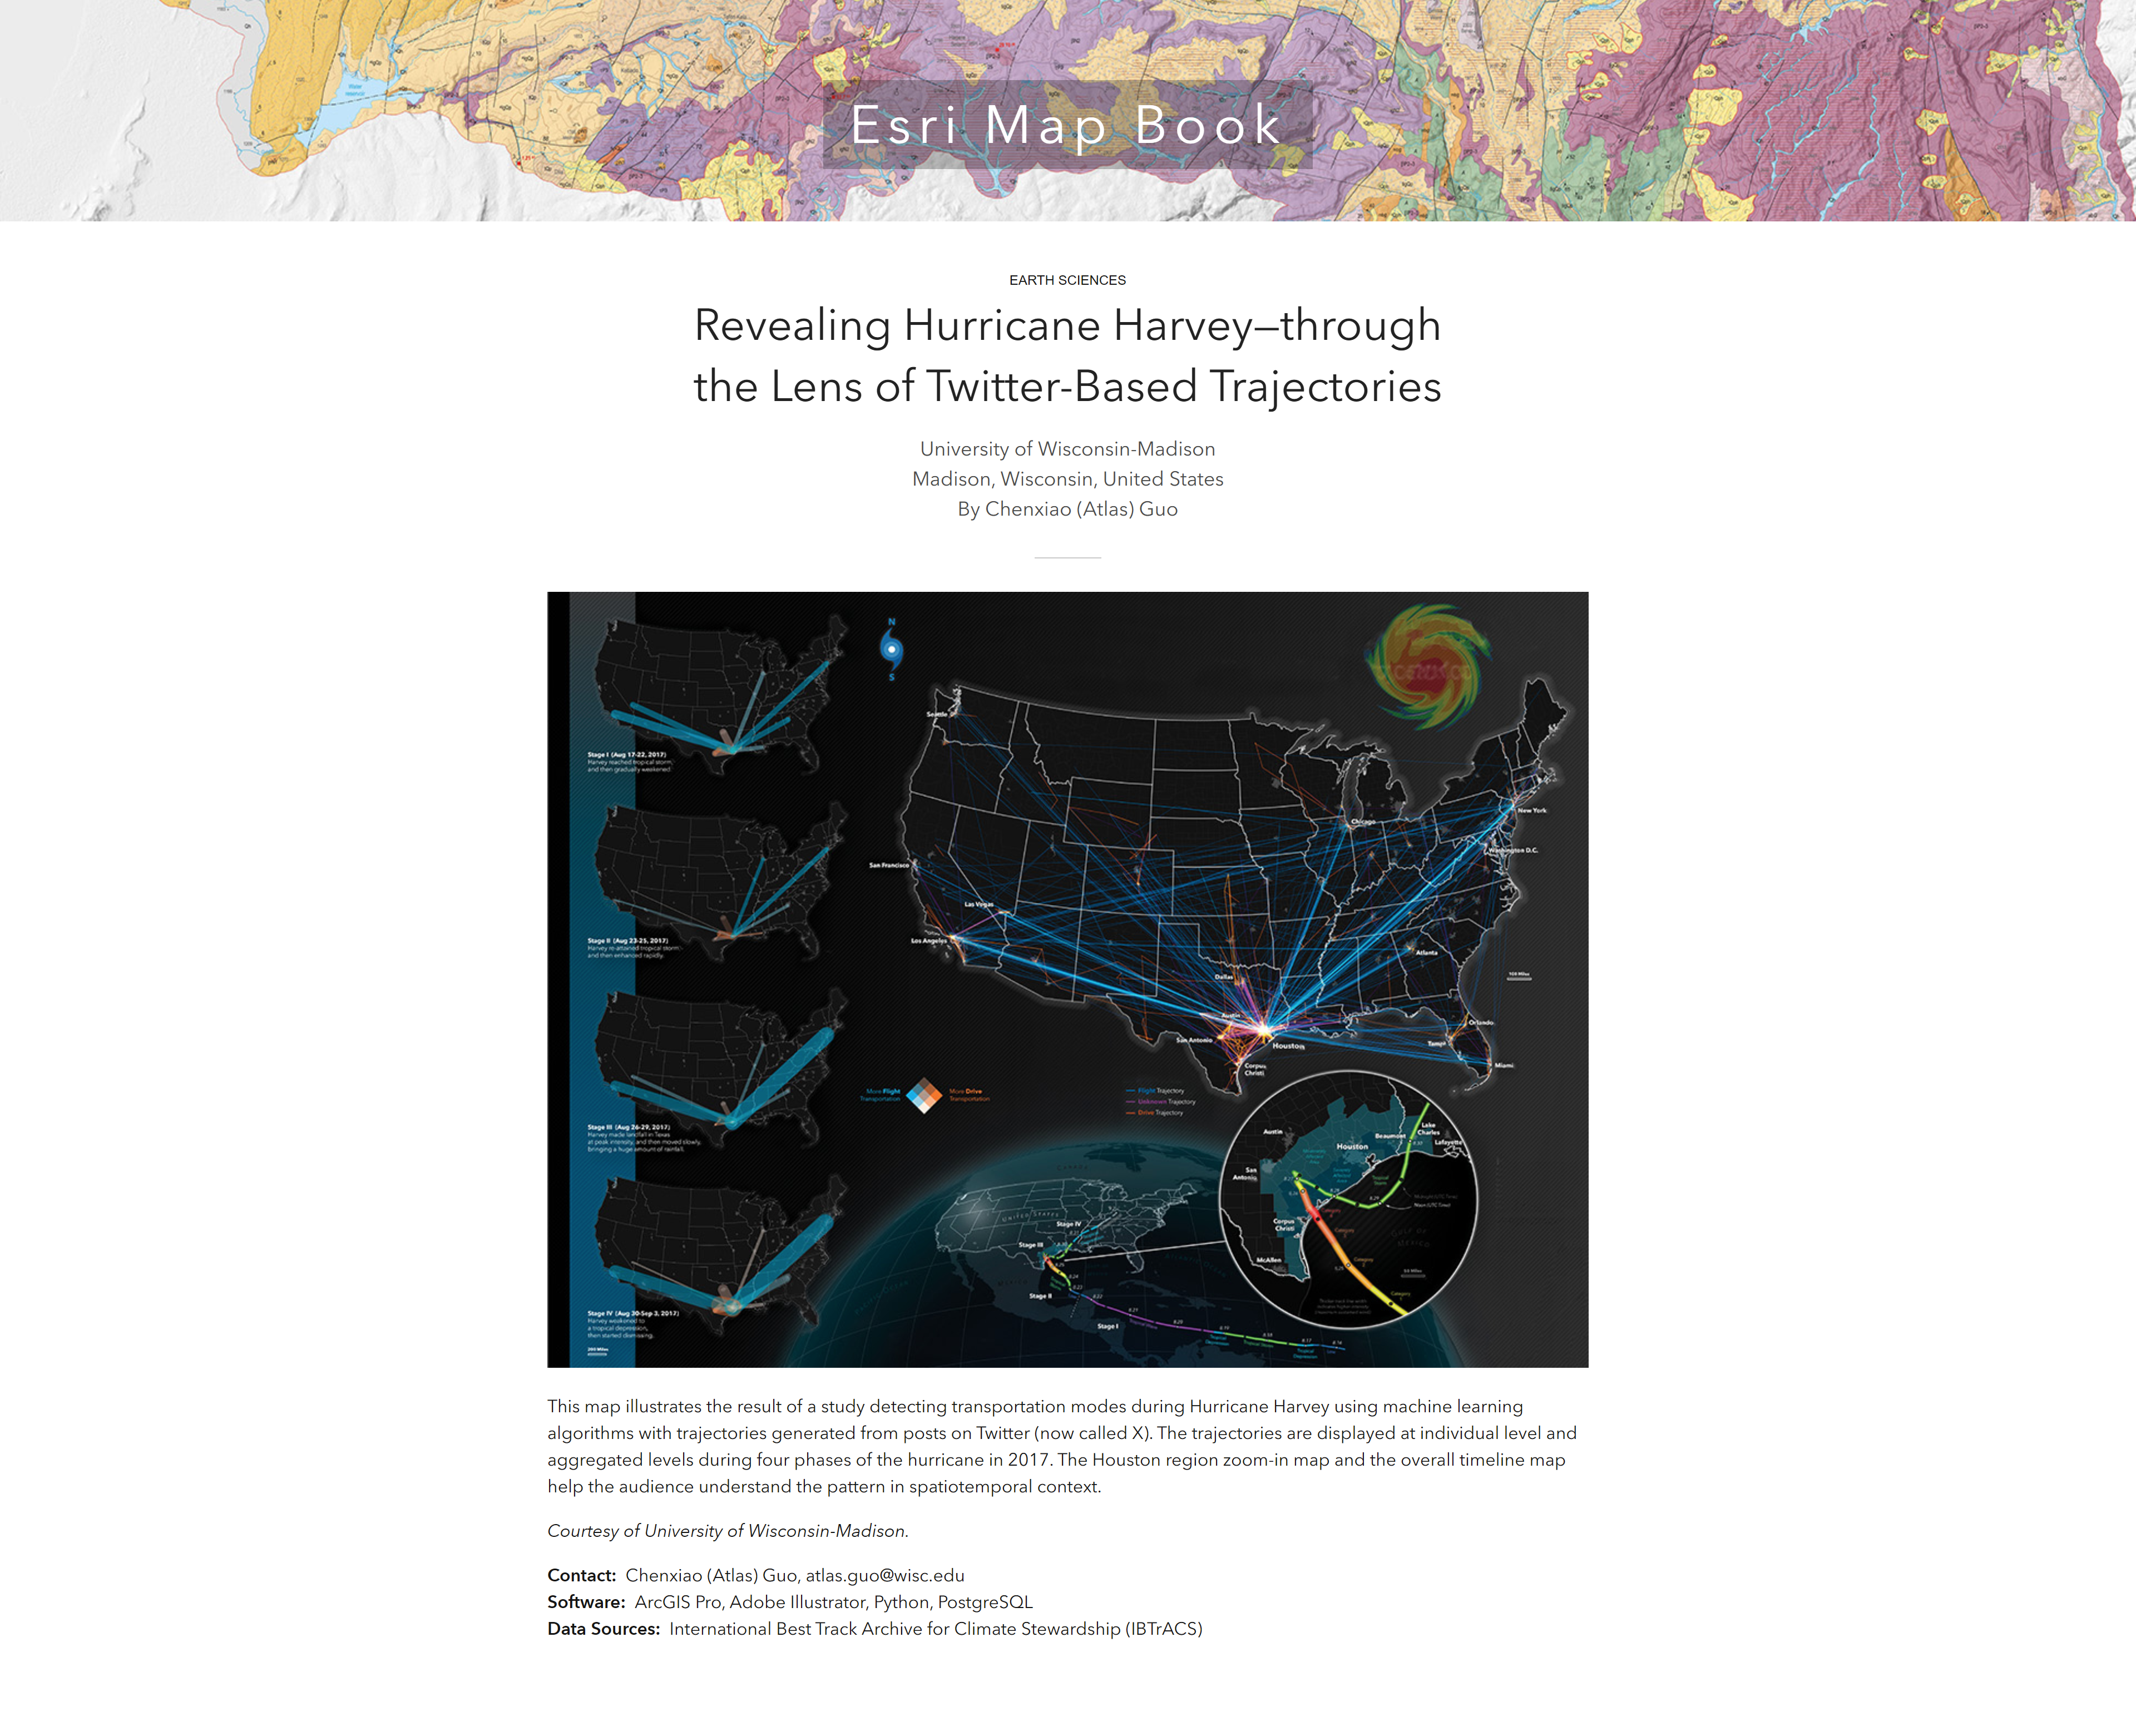
Revealing Hurricane Harvey 2017
Geovisualization of Twitter-based trajectories; on Esri Map Book Vol.39
 Download Compressed Image
Download Full-Size Image
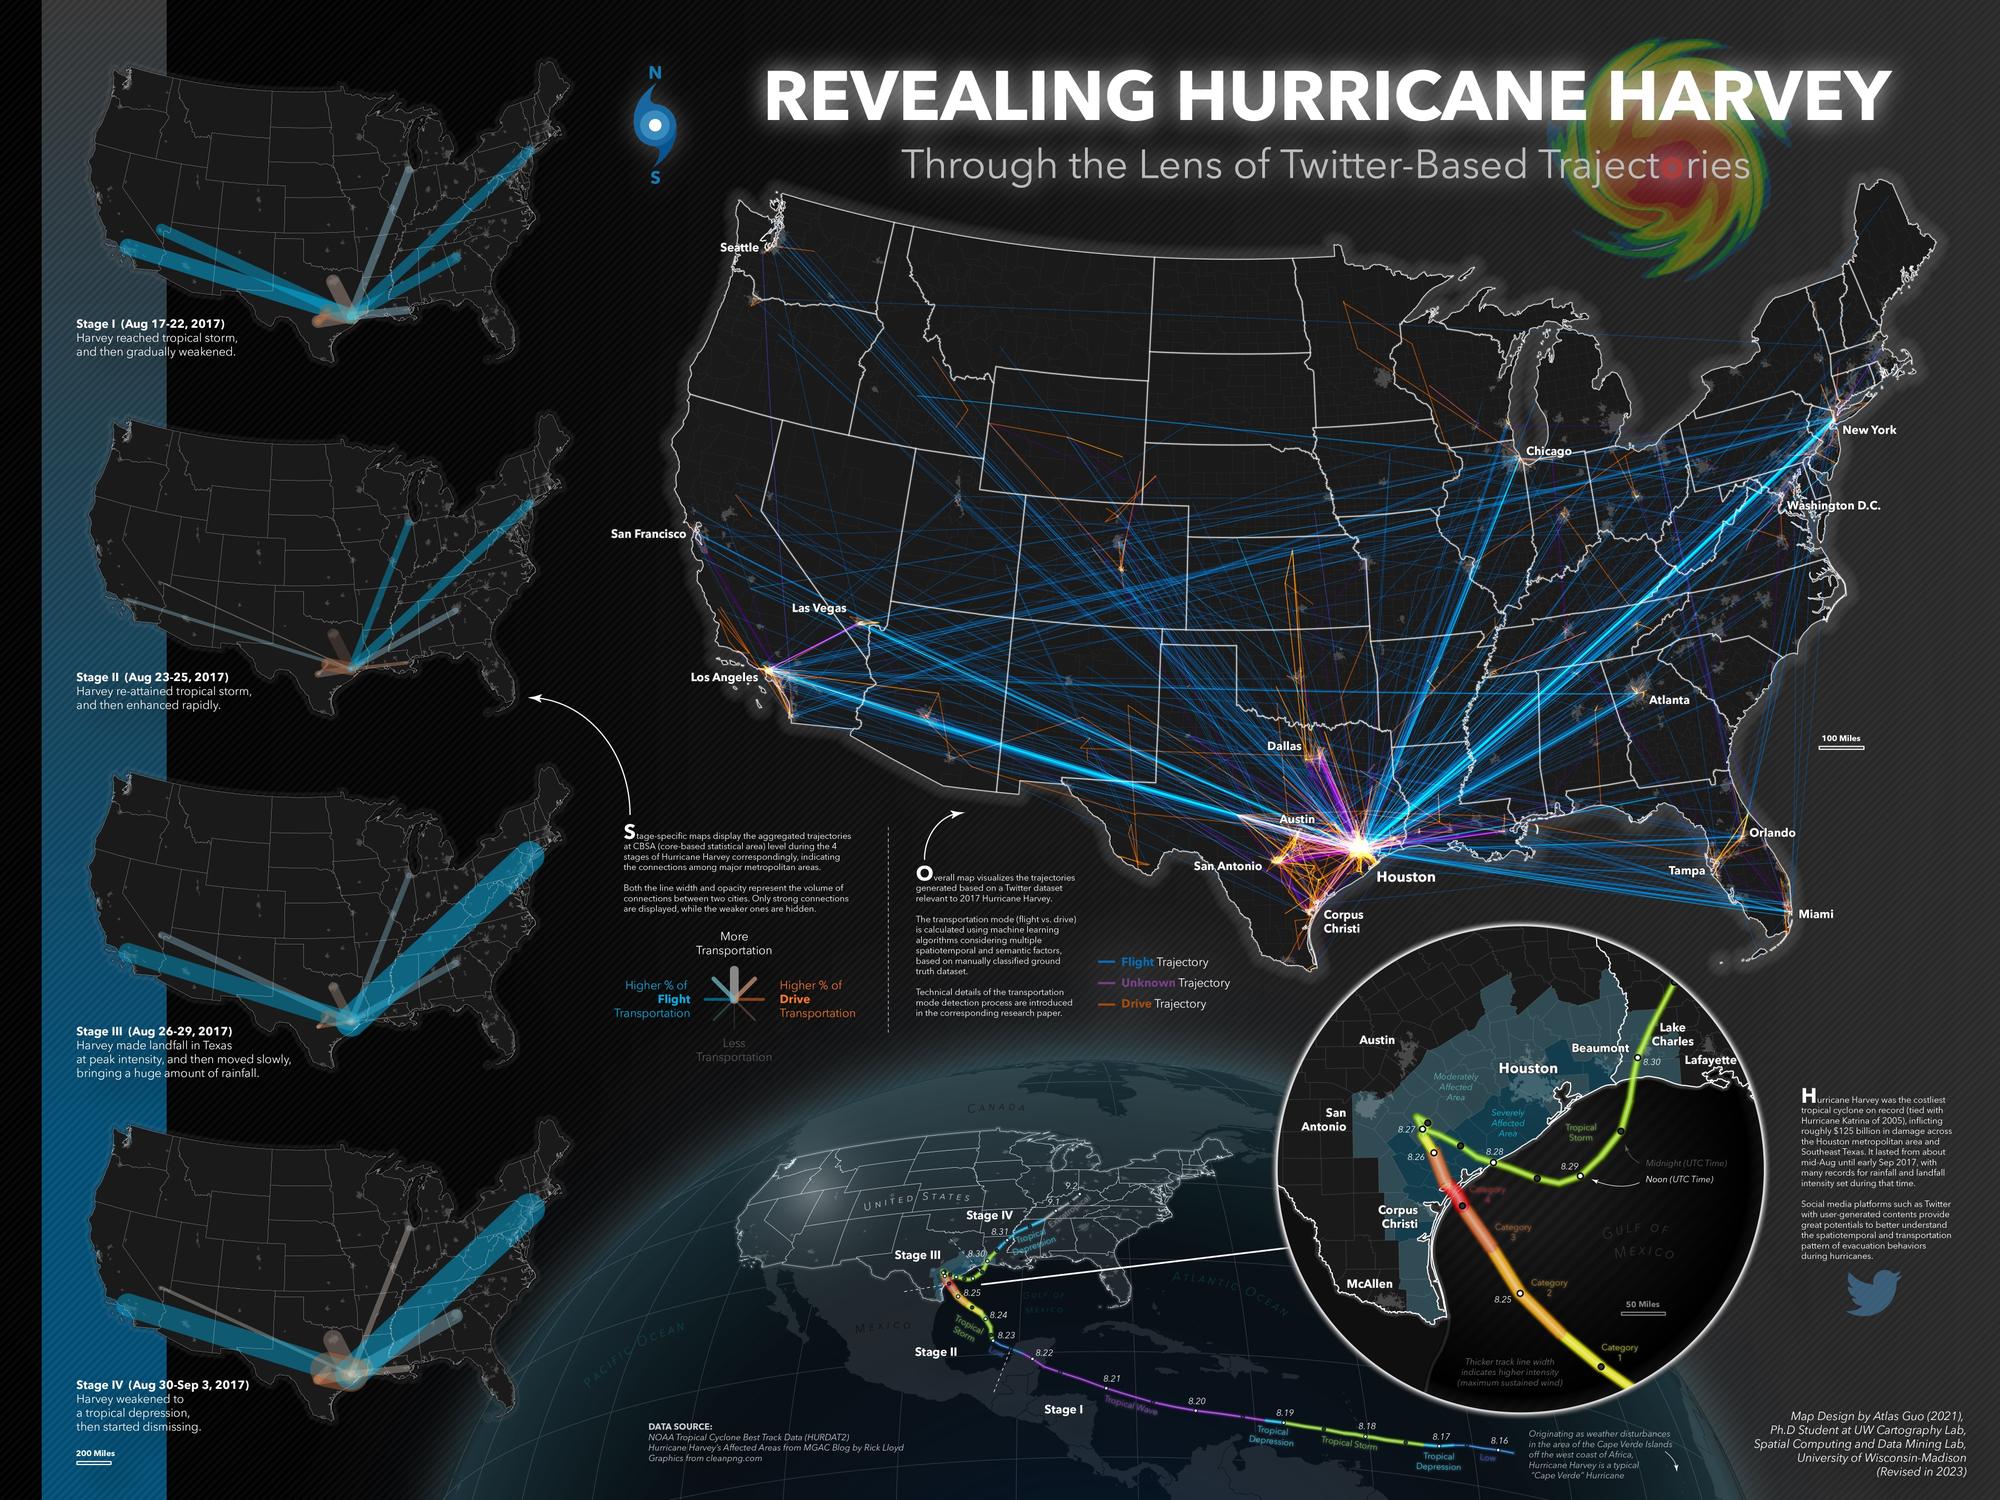
Social media platforms such as Twitter with user-generated contents provide great potentials to better
understand the spatiotemporal and transportation pattern of evacuation
behaviors during hurricanes. Hurricane Harvey was the costliest tropical cyclone on record (tied with
Hurricane Katrina of 2005), inflicting roughly $125 billion in damage across the
Houston metropolitan area and Southeast Texas. It lasted from about mid-Aug until early Sep 2017, with
many records for rainfall and landfall intensity set during that time.
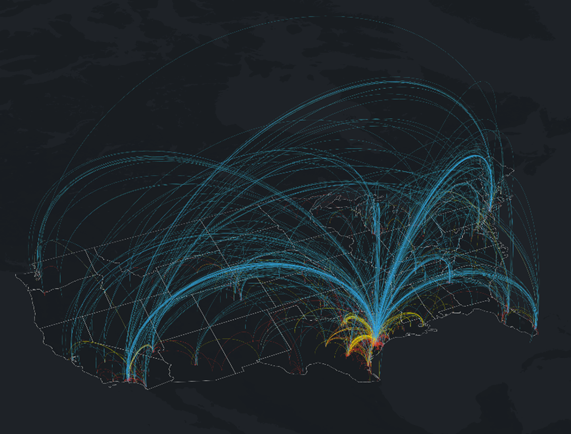
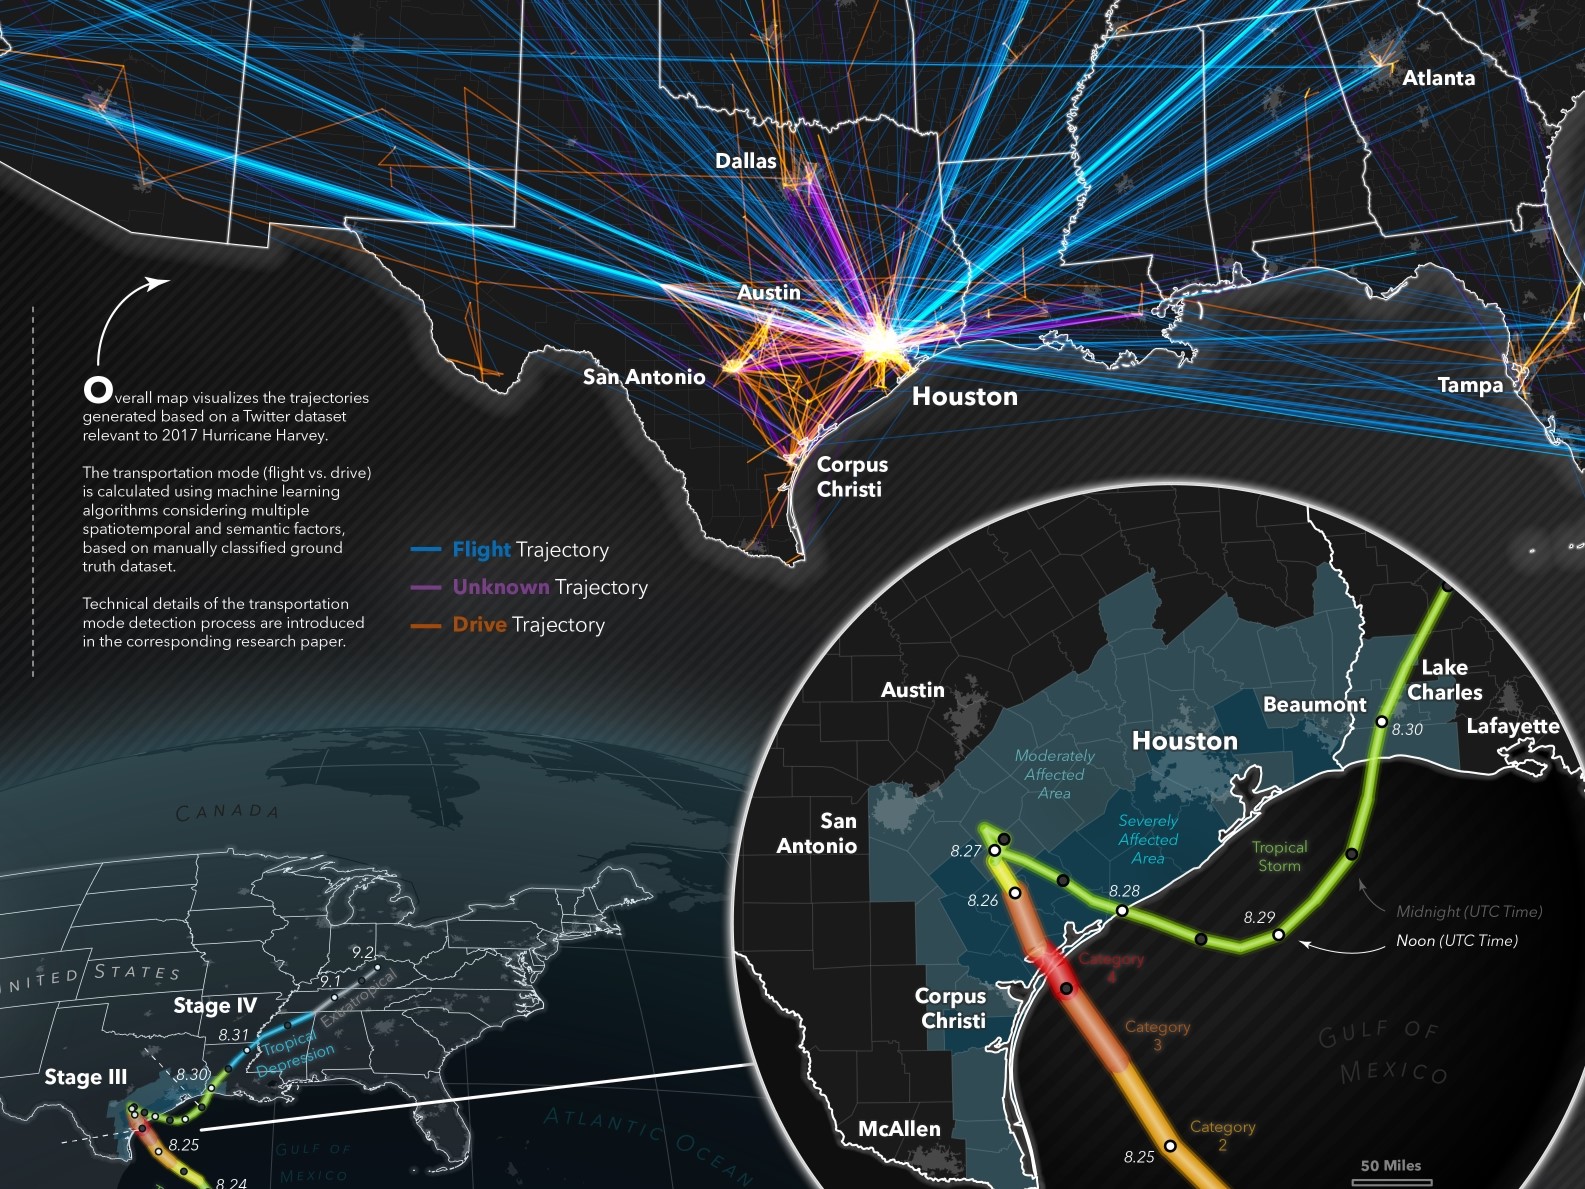 The overall map visualizes the trajectories generated based on a Twitter dataset relevant to 2017
Hurricane Harvey. The transportation mode (flight vs. drive) is calculated using
machine learning algorithms considering multiple spatiotemporal and semantic factors, based on manually
classified ground truth dataset. Technical details of the transportation mode
detection process are introduced in the corresponding research paper. The four stage-specific maps
display the aggregated trajectories at CBSA (core-based statistical area) level
during the 4 stages of Hurricane Harvey correspondingly, indicating the connections among major
metropolitan areas. Both the line width and opacity represent the volume of
connections between two cities. Only strong connections are displayed, while the weaker ones are hidden.
The overall map visualizes the trajectories generated based on a Twitter dataset relevant to 2017
Hurricane Harvey. The transportation mode (flight vs. drive) is calculated using
machine learning algorithms considering multiple spatiotemporal and semantic factors, based on manually
classified ground truth dataset. Technical details of the transportation mode
detection process are introduced in the corresponding research paper. The four stage-specific maps
display the aggregated trajectories at CBSA (core-based statistical area) level
during the 4 stages of Hurricane Harvey correspondingly, indicating the connections among major
metropolitan areas. Both the line width and opacity represent the volume of
connections between two cities. Only strong connections are displayed, while the weaker ones are hidden.
This map is published on
Esri Map Book Volume
39
(2024).
The initial version is presented at North American Cartographic Information Society (NACIS)
2021 Student Map Gallery. The updated version
is displayed at
Map Gallery
of Big Ten Academic Alliance (BTAA) Geospatial Information Network (GIN) 2023 Conference.
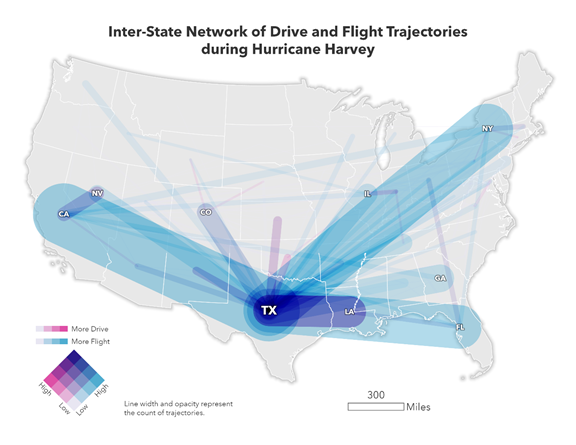
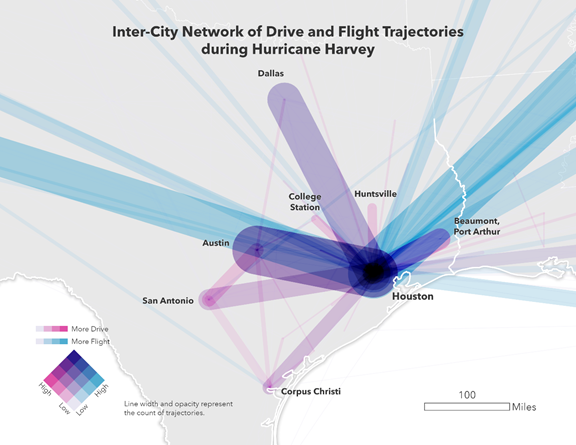
Below are examples of original maps in research paper which this comprehensive map is based on.