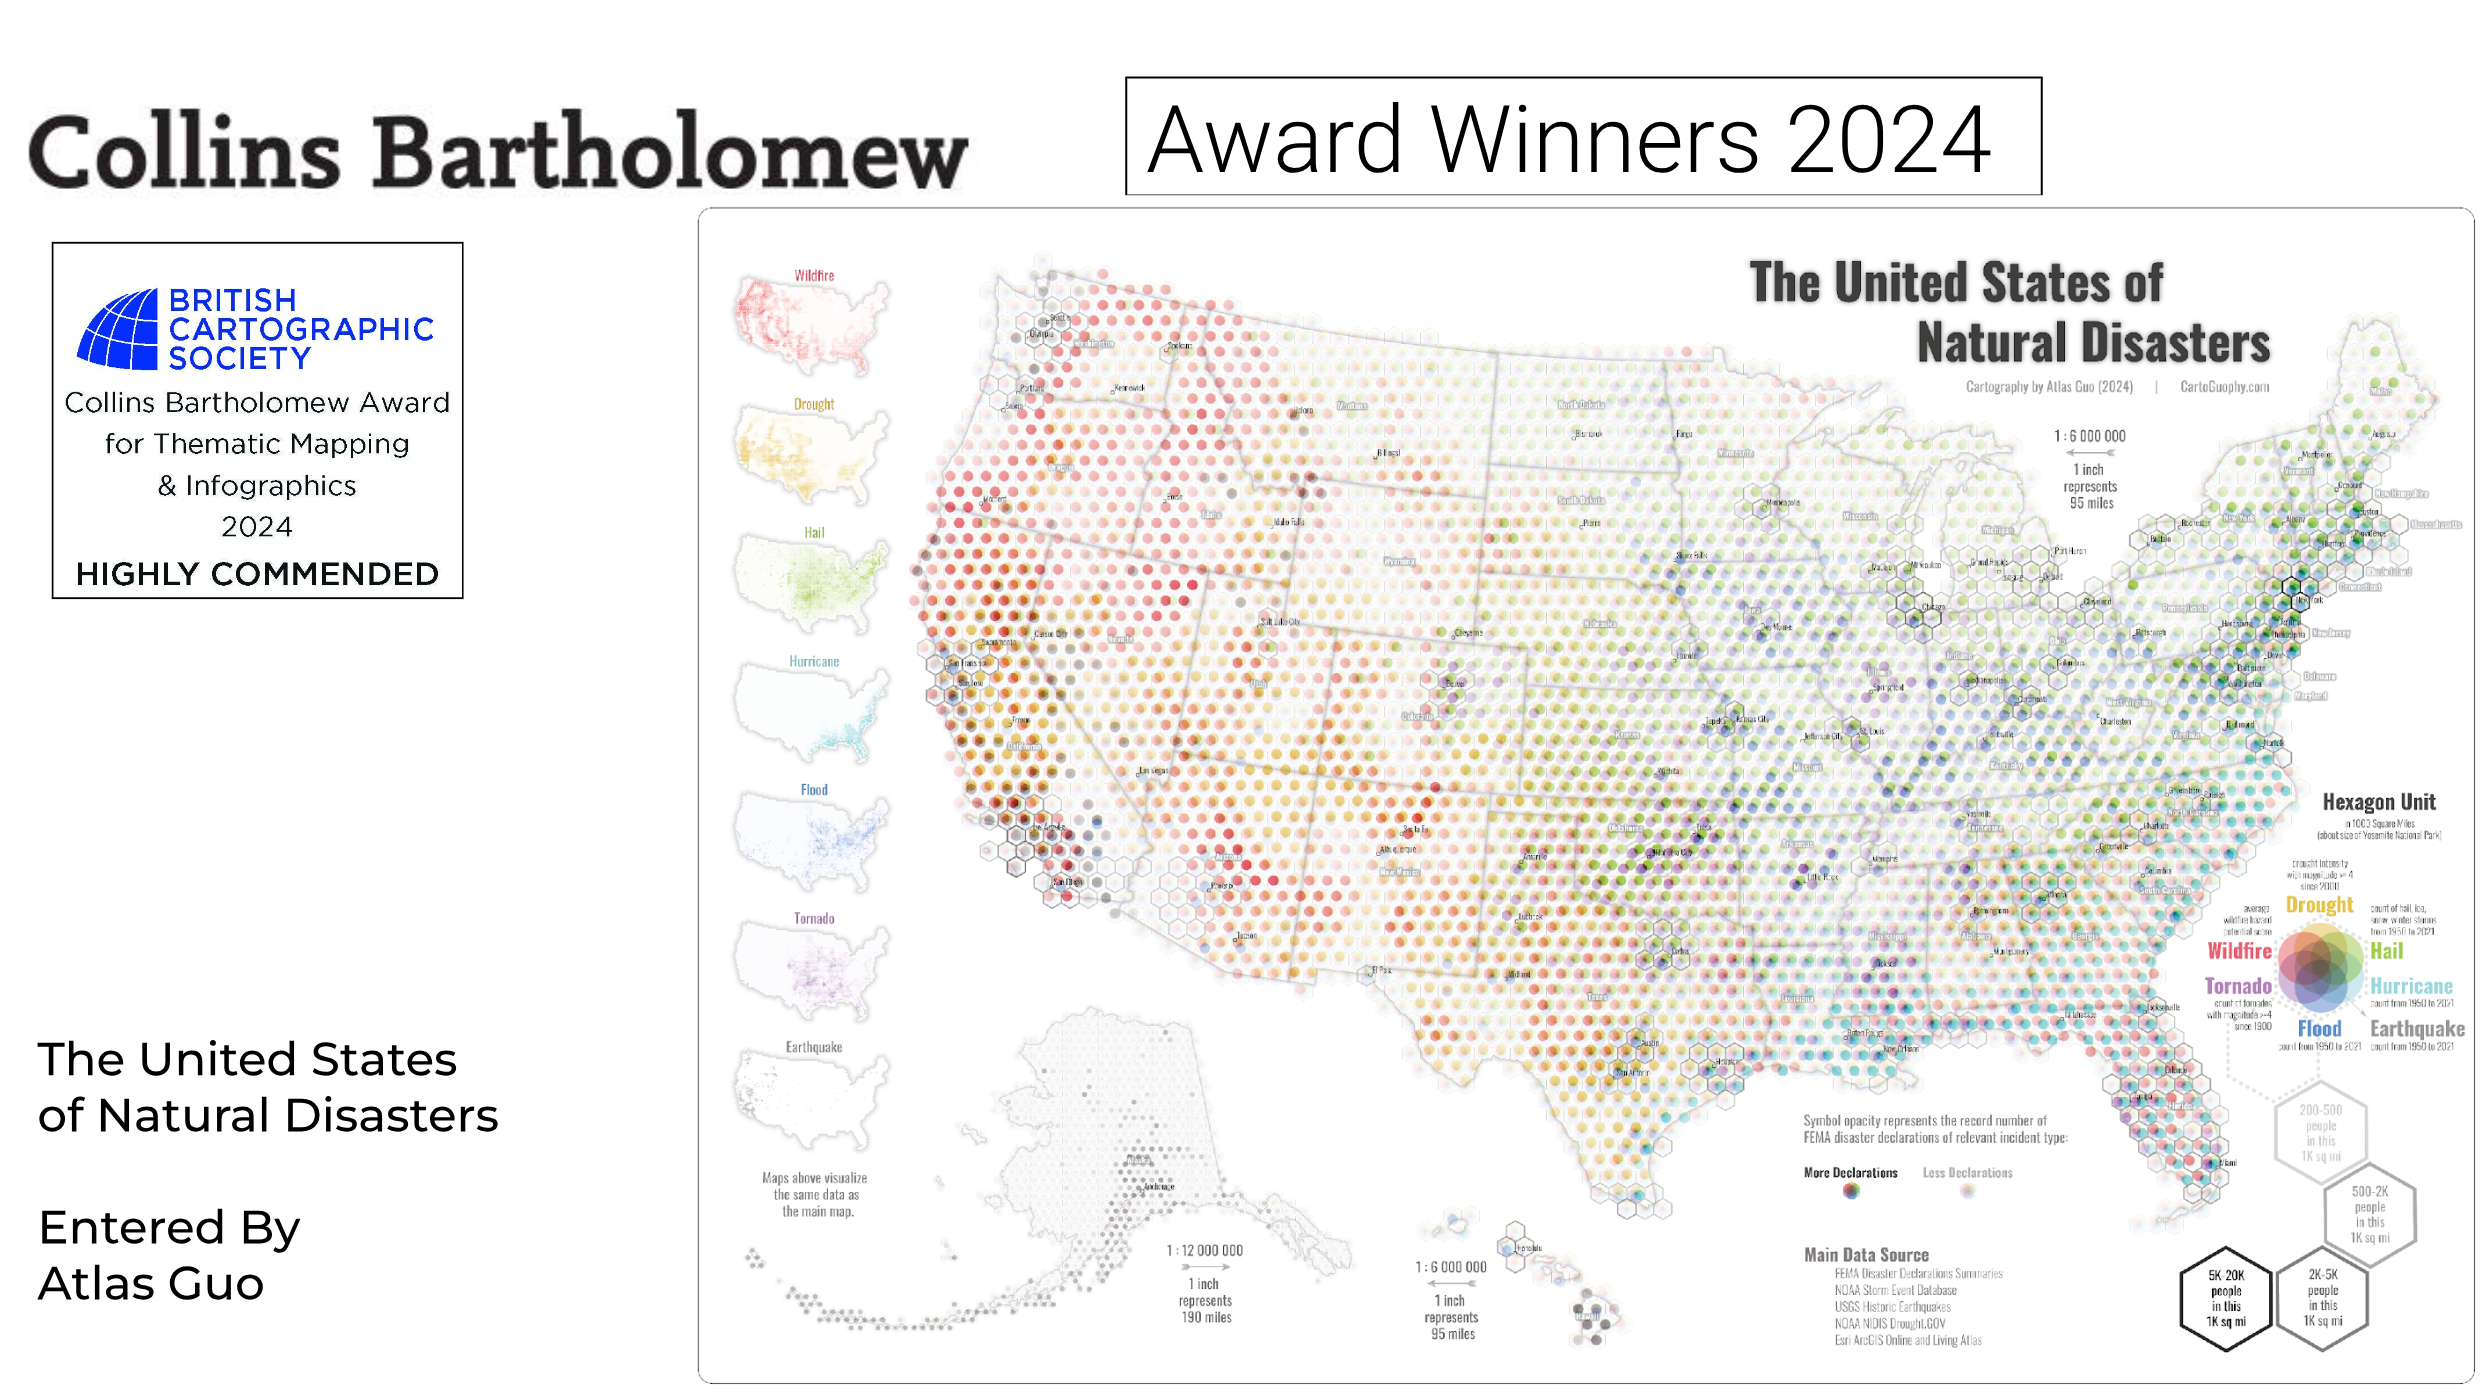
United States of Natural Disasters
Best Research Map in NACIS 2024; Best Cartography Award, Most Innovative Map in Esri UC 2024; Runner-Up in Thematic Map and Keynotes Choice in WLIA 2024; Runner-Up (Highly Commended) in 2024 BCS Thematic Mapping Award
 Download Compressed Image
Download Full-Size Image
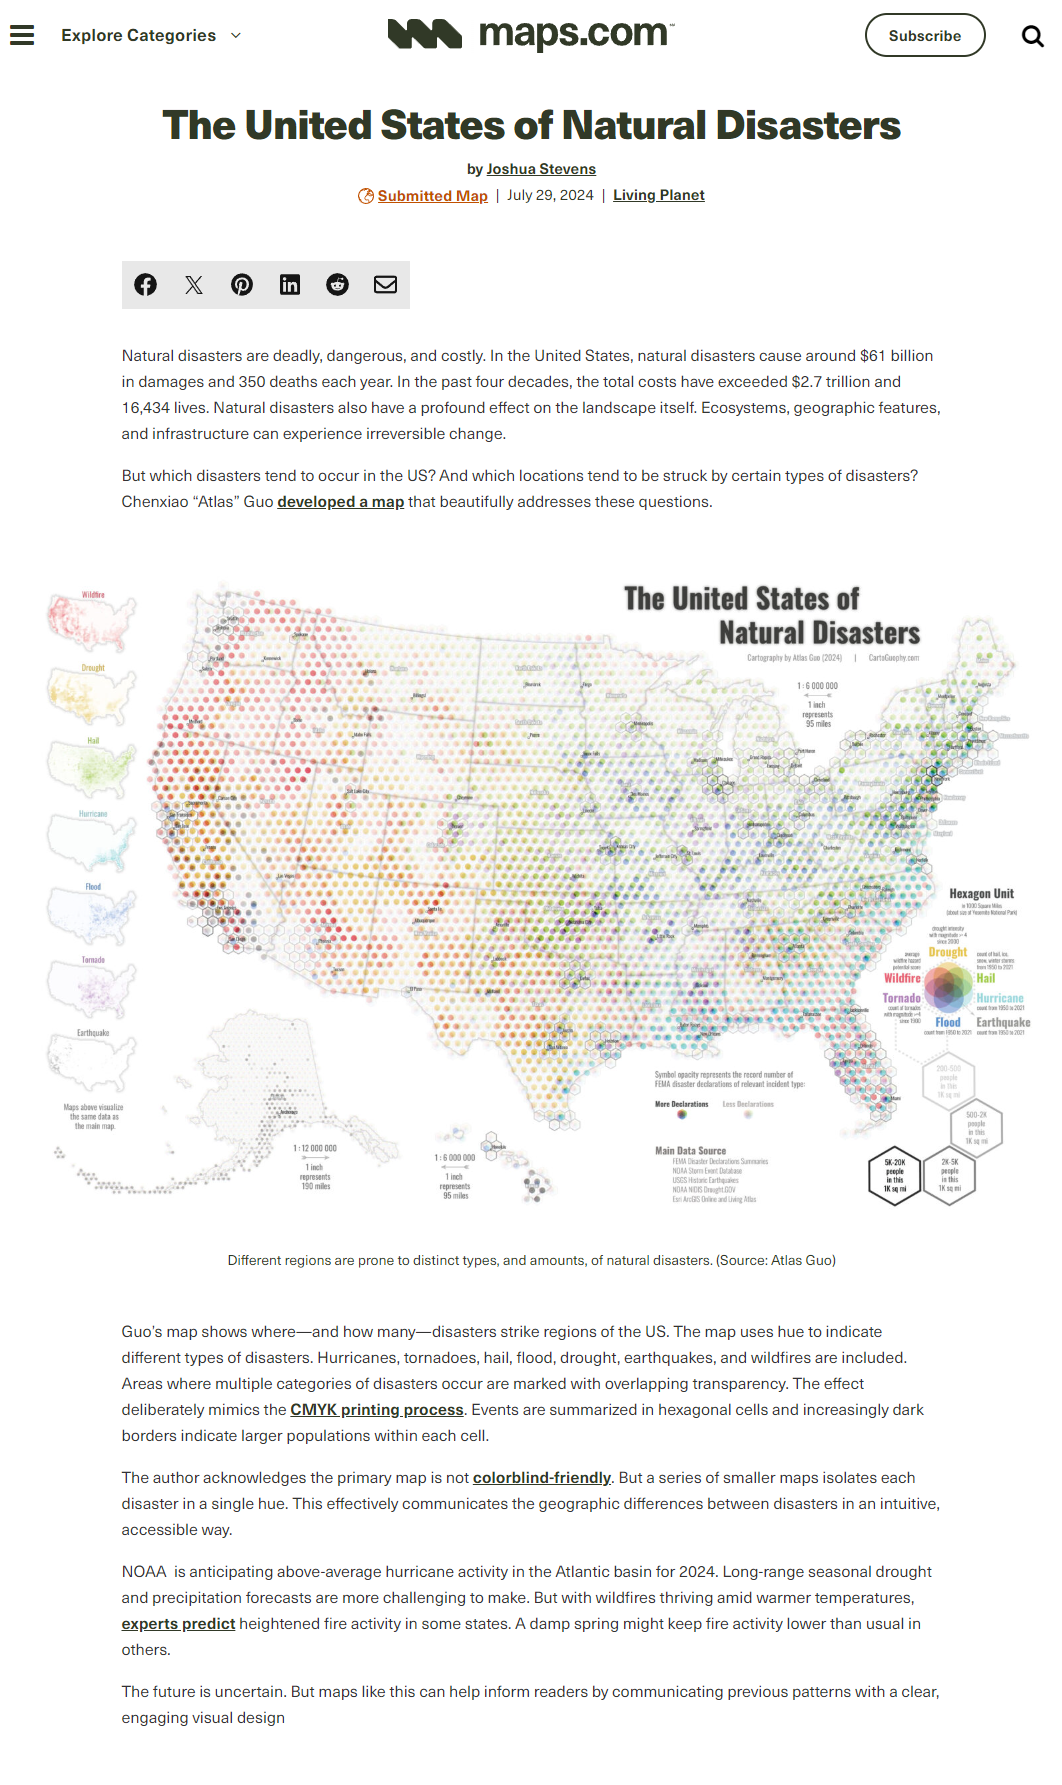
This map presents an innovative and comprehensive visualization of U.S. natural disasters of various
types, allowing the map readers to acquire information from both overview and
spatial-semantic specific perspectives.
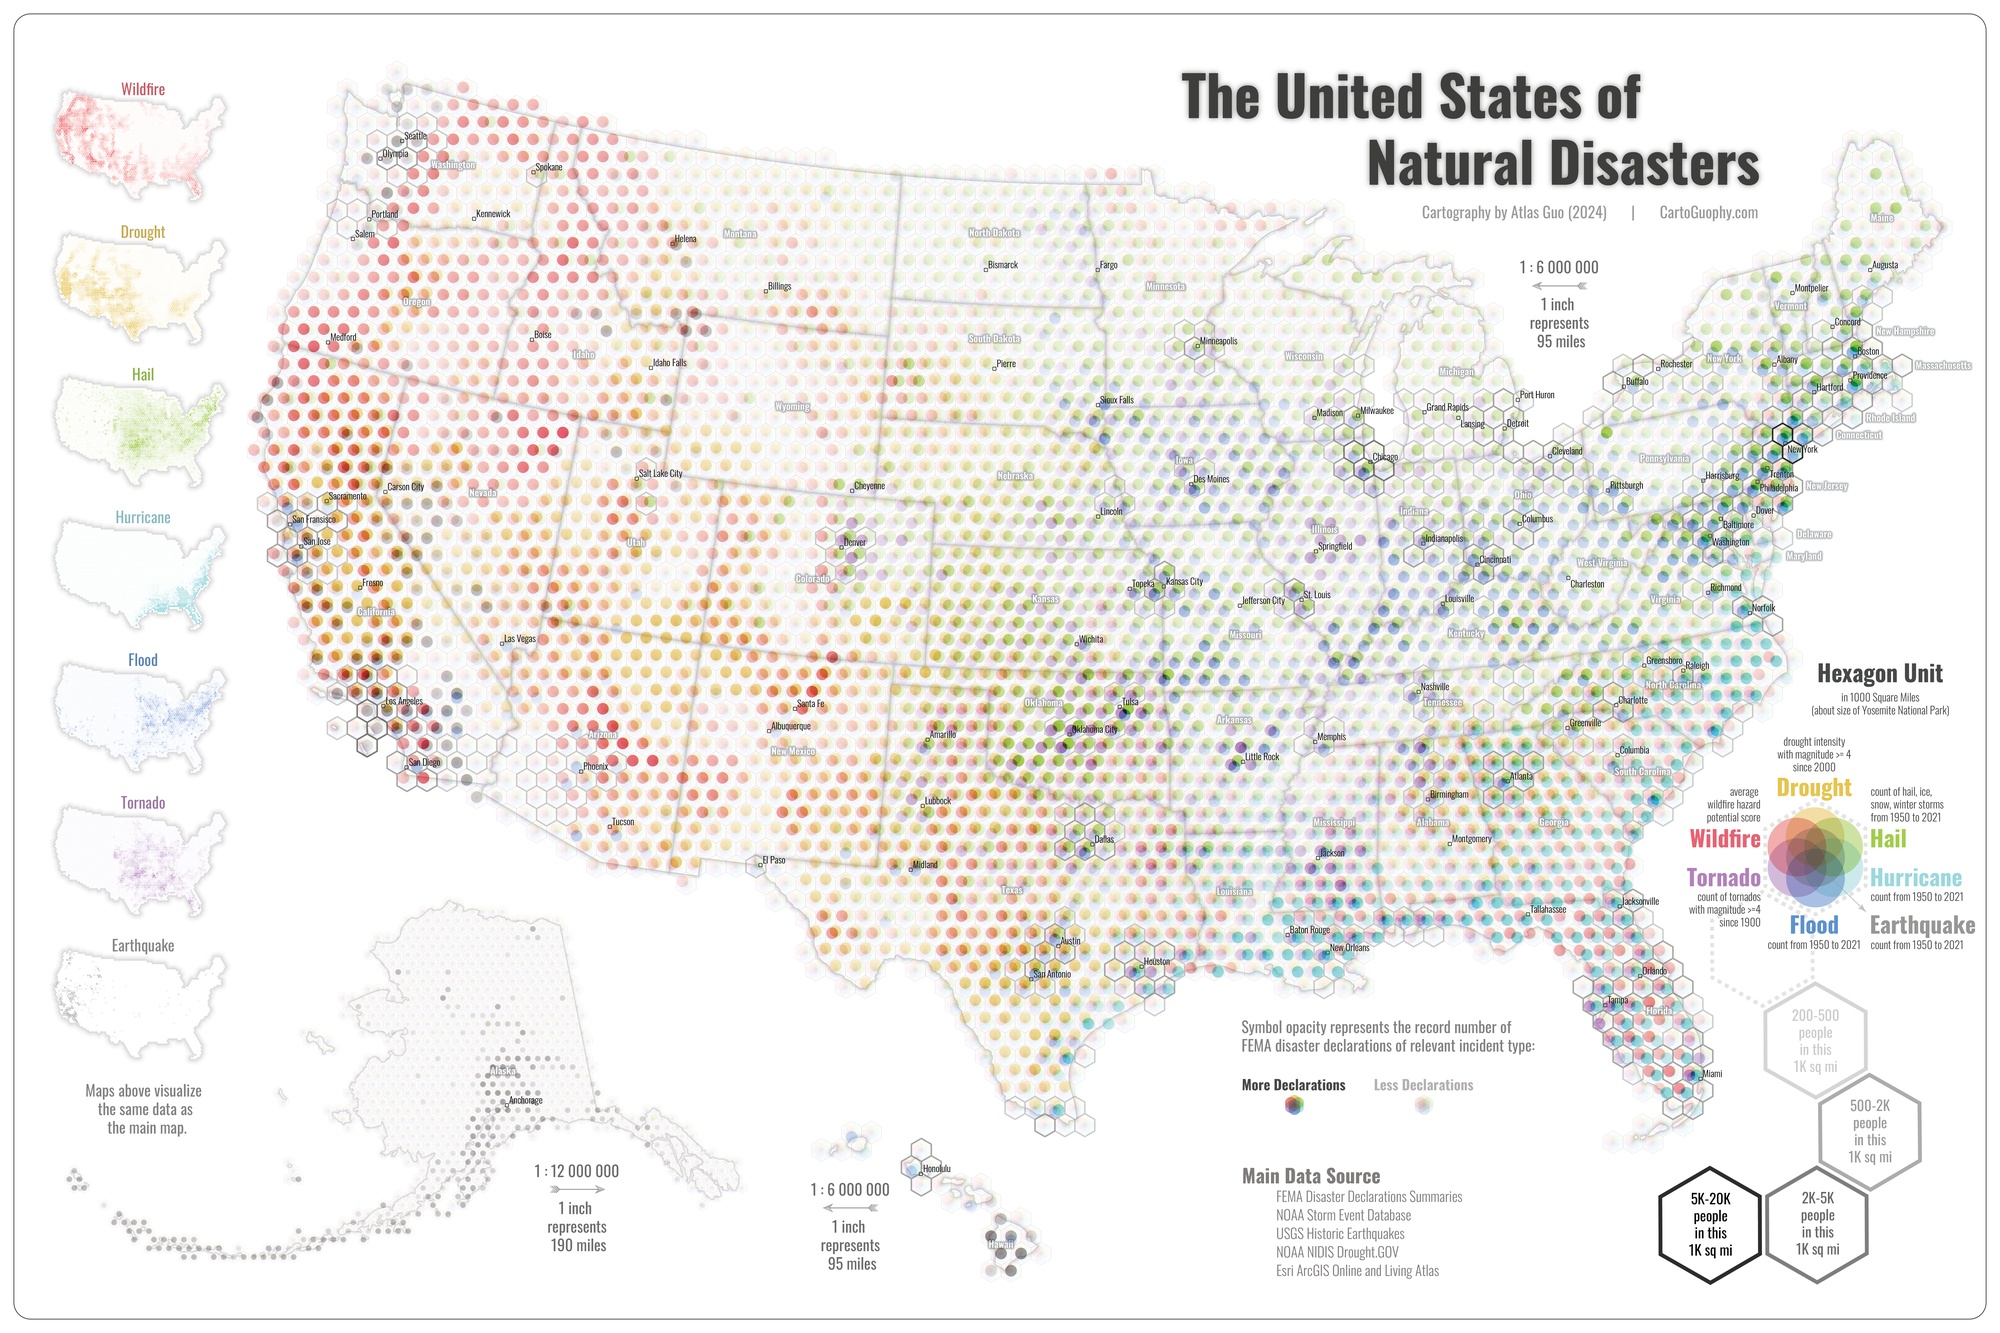
The major eye-catching element in this map would be the multivariate symbol design. To evenly divide the
space with rooms for multiple visual vehicles, the hexagon unit is chosen,
which also balances the functionality and aesthetics. The general idea is to split each hexagon unit
into 6 parts (or 7, including the central one), associated with different color
hue all around the color wheel. Due to the natural of different colors, the lightness (HSL) or value
(HSV) are carefully controlled to minimize the other potential variations as
visual variable.
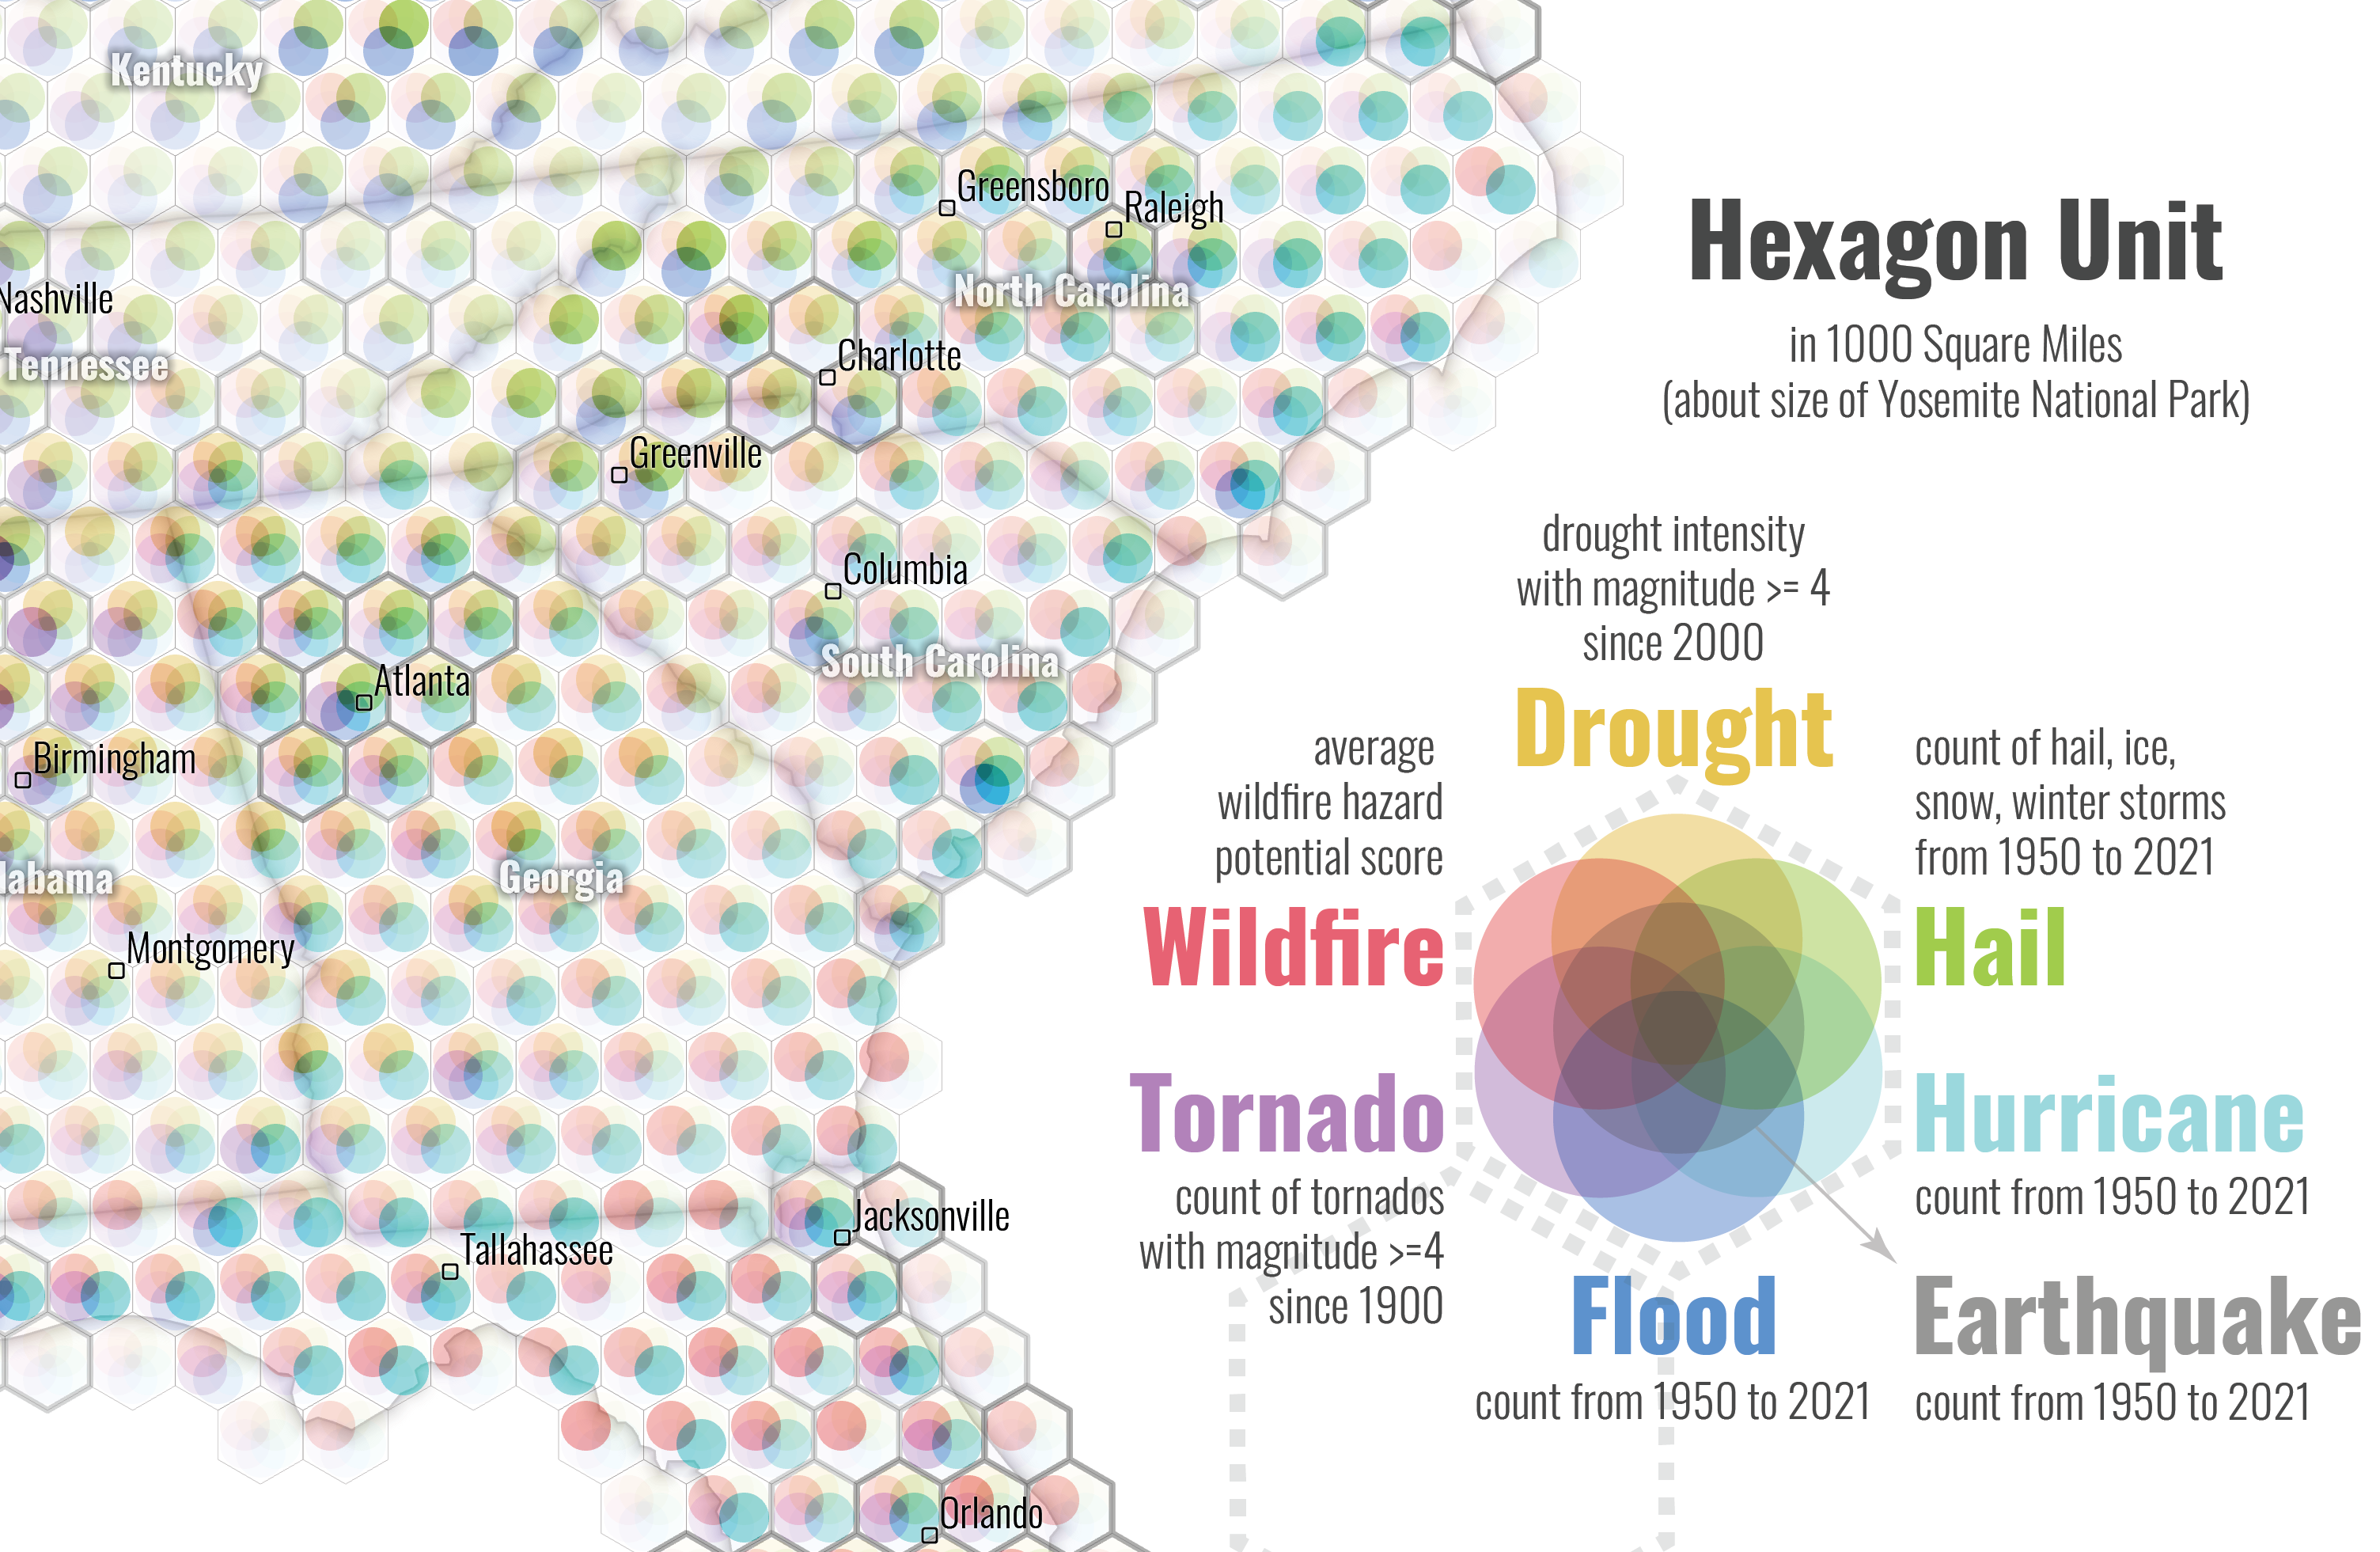 There is arguably barely perfect solution to arrange 6 or 7 natural disaster types in the order of color
wheel spectrum, but efforts are still made to maximize the potential
cognitive association. For example, red color for wildfire, yellow for drought, blue for hurricane;
while flood appears at the bottom, earthquake comes from the core, etc.
There is arguably barely perfect solution to arrange 6 or 7 natural disaster types in the order of color
wheel spectrum, but efforts are still made to maximize the potential
cognitive association. For example, red color for wildfire, yellow for drought, blue for hurricane;
while flood appears at the bottom, earthquake comes from the core, etc.
The design inspiration actually comes from the old printing effect, such as the dots in “halftone”. In
CMYK printing, especially those in worse quality, we can still see the colorful
dots when close enough. But if we take a step back, the dots work organically to display an image.
Therefore, I originally evenly filled 7 round shapes in each hexagon without any
overlapping. It turned out though individual values are clear to get, the overall visual effect tends to
be grayed out too much. I kept exploring from this side (no overlapping), all
the way to the opposite side (entire overlapping of 7 round shapes) which leads to a much clear overall
pattern but no way to retrieve individual variables. After many tests in
printed version, I got the current configuration with partial overlapping, keeping a good balance
between a clear overall pattern and capability of individual variable retrieval.
With major designs highly relying on color-hue (even the entire color wheel), this map is probably not
targeting at communities with color blindness. Even if there seems not to be a
perfect solution for that, all relevant feedback is highly welcomed.
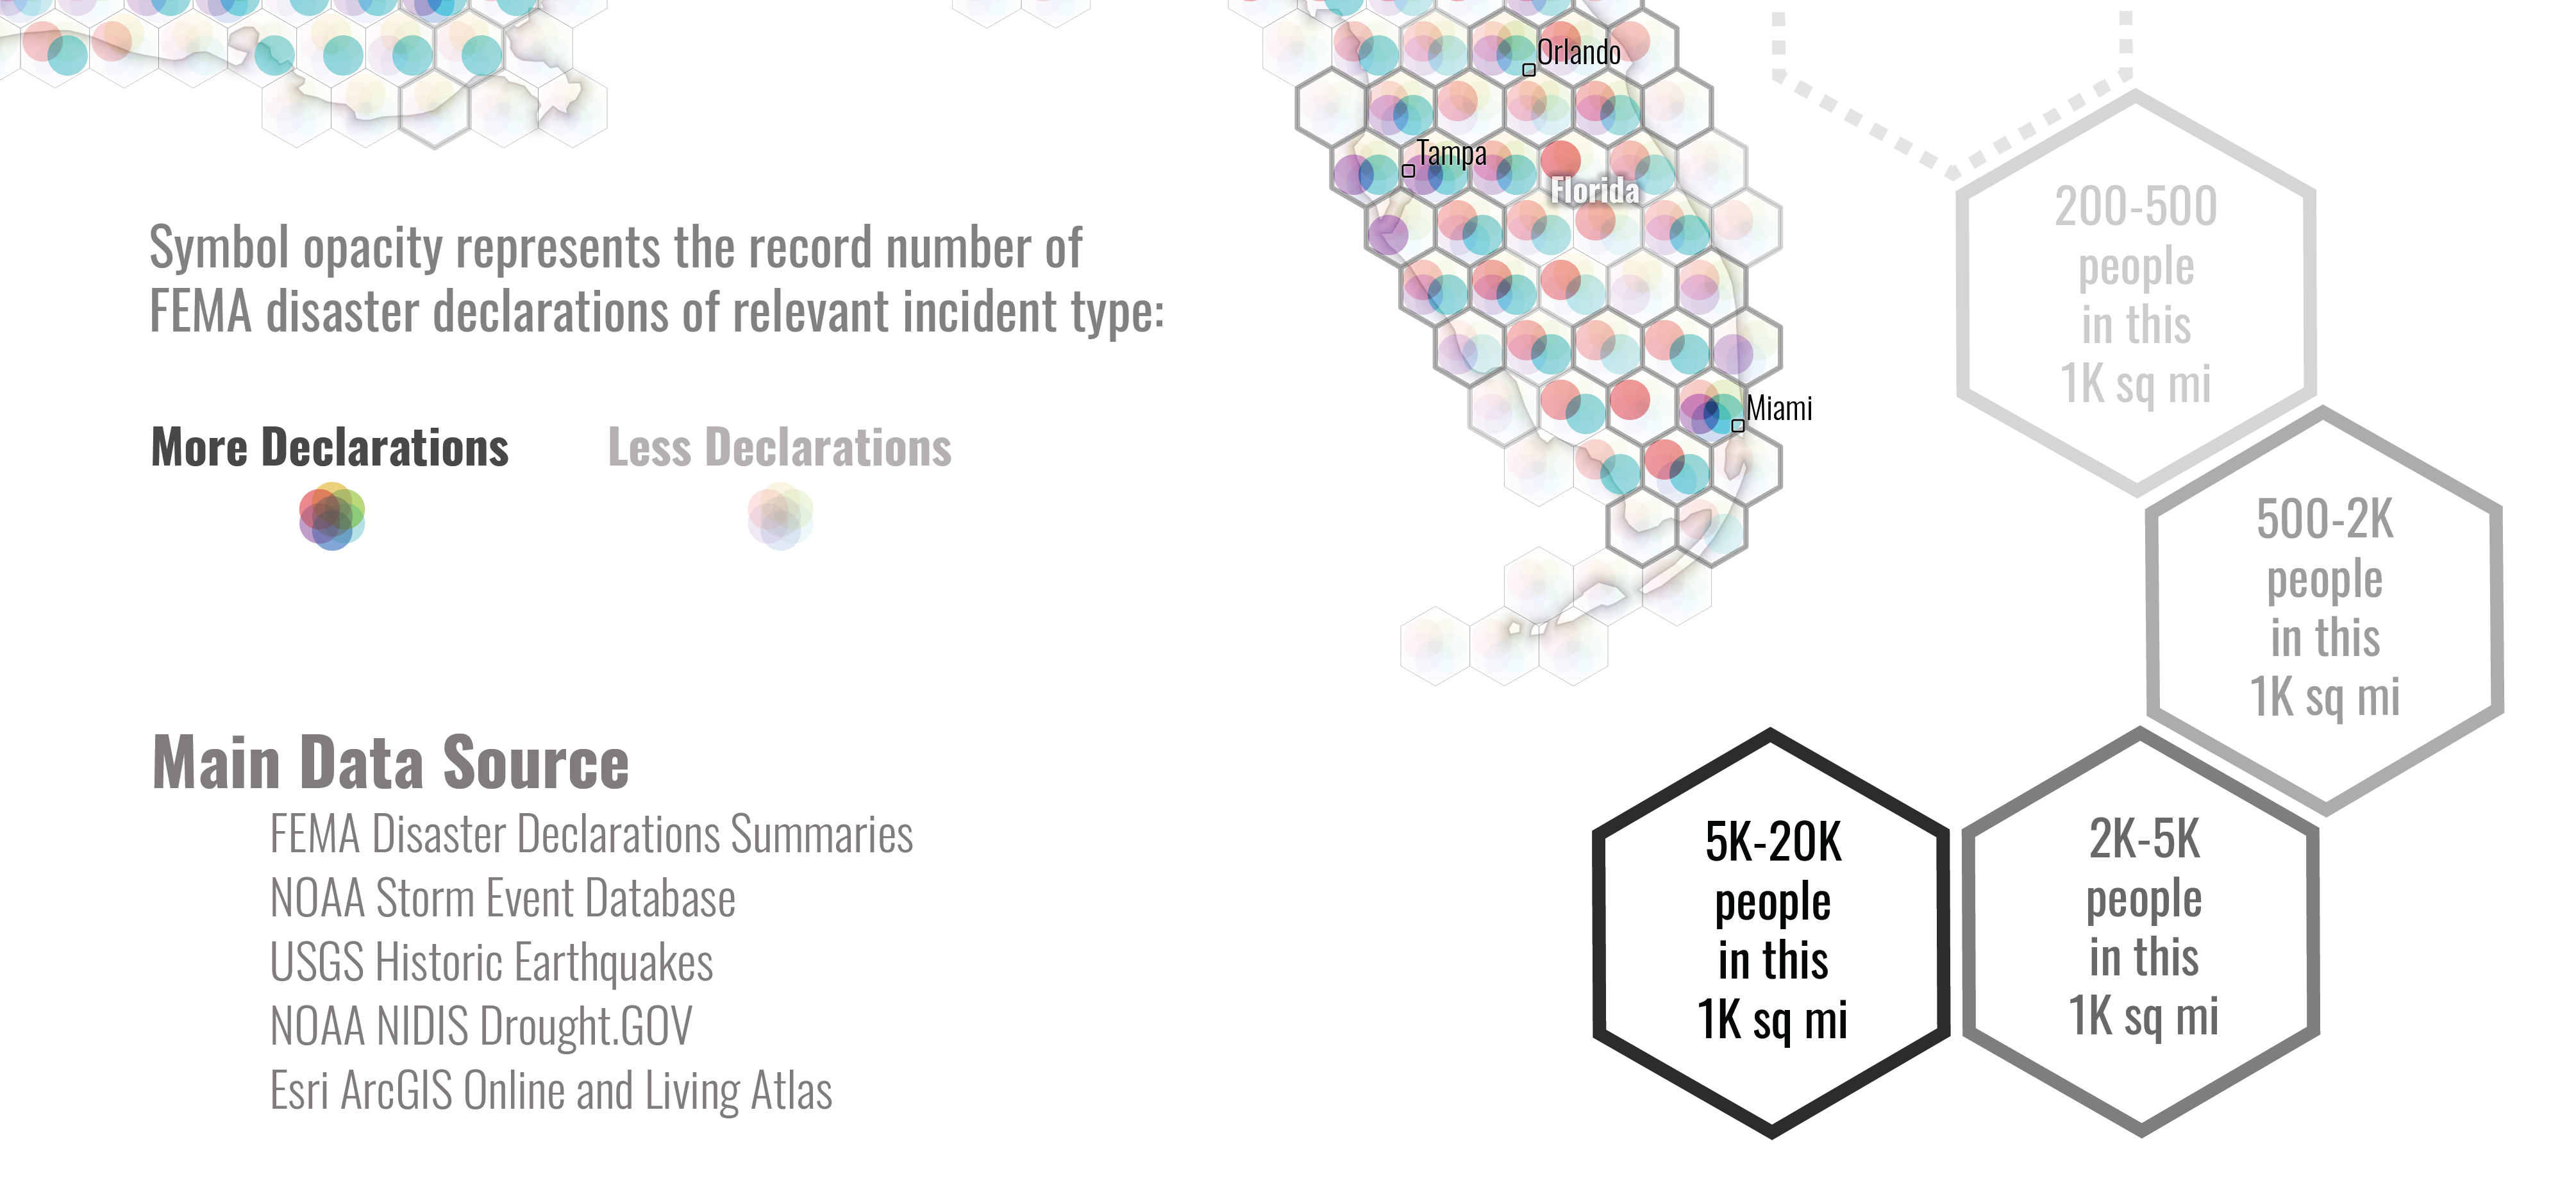 Besides the color (hue), the opacity of each sub-symbol also variates from full to half, representing
the record number from FEMA disaster declarations of relevant disaster type. To
better understand the social effect of the natural disasters, the population density is illustrated in
different shade levels of hexagon edges. Additionally, the univariate maps are
also provided on the left side for further exploration.
Besides the color (hue), the opacity of each sub-symbol also variates from full to half, representing
the record number from FEMA disaster declarations of relevant disaster type. To
better understand the social effect of the natural disasters, the population density is illustrated in
different shade levels of hexagon edges. Additionally, the univariate maps are
also provided on the left side for further exploration.
The statistical units in 1000 sq mile hexagon are generated under North America Albers equivalent
projection, targeting at presenting both the contiguous part and two outside states.
Some computing strategies are applied during the data processing procedure of disaster related variables
and the population density. Though the data processing and analytics are much
less important than the efforts on symbol design, everything is seriously treated as expected.
Major data source: FEMA disaster declaration summaries, NOAA storm event database, USGS historic
earthquakes, NOAA NIDIS Drought.GOV, Esri ArcGIS Online and Living Atlas.
In March 2024, This map won the Runner-Up (2nd place) of Thematic Map, and Keynotes' Choice in
Wisconsin Land Information Association (WLIA) 2024 Map Contest, and is featured in
news by
UW-Madison Geography Department.
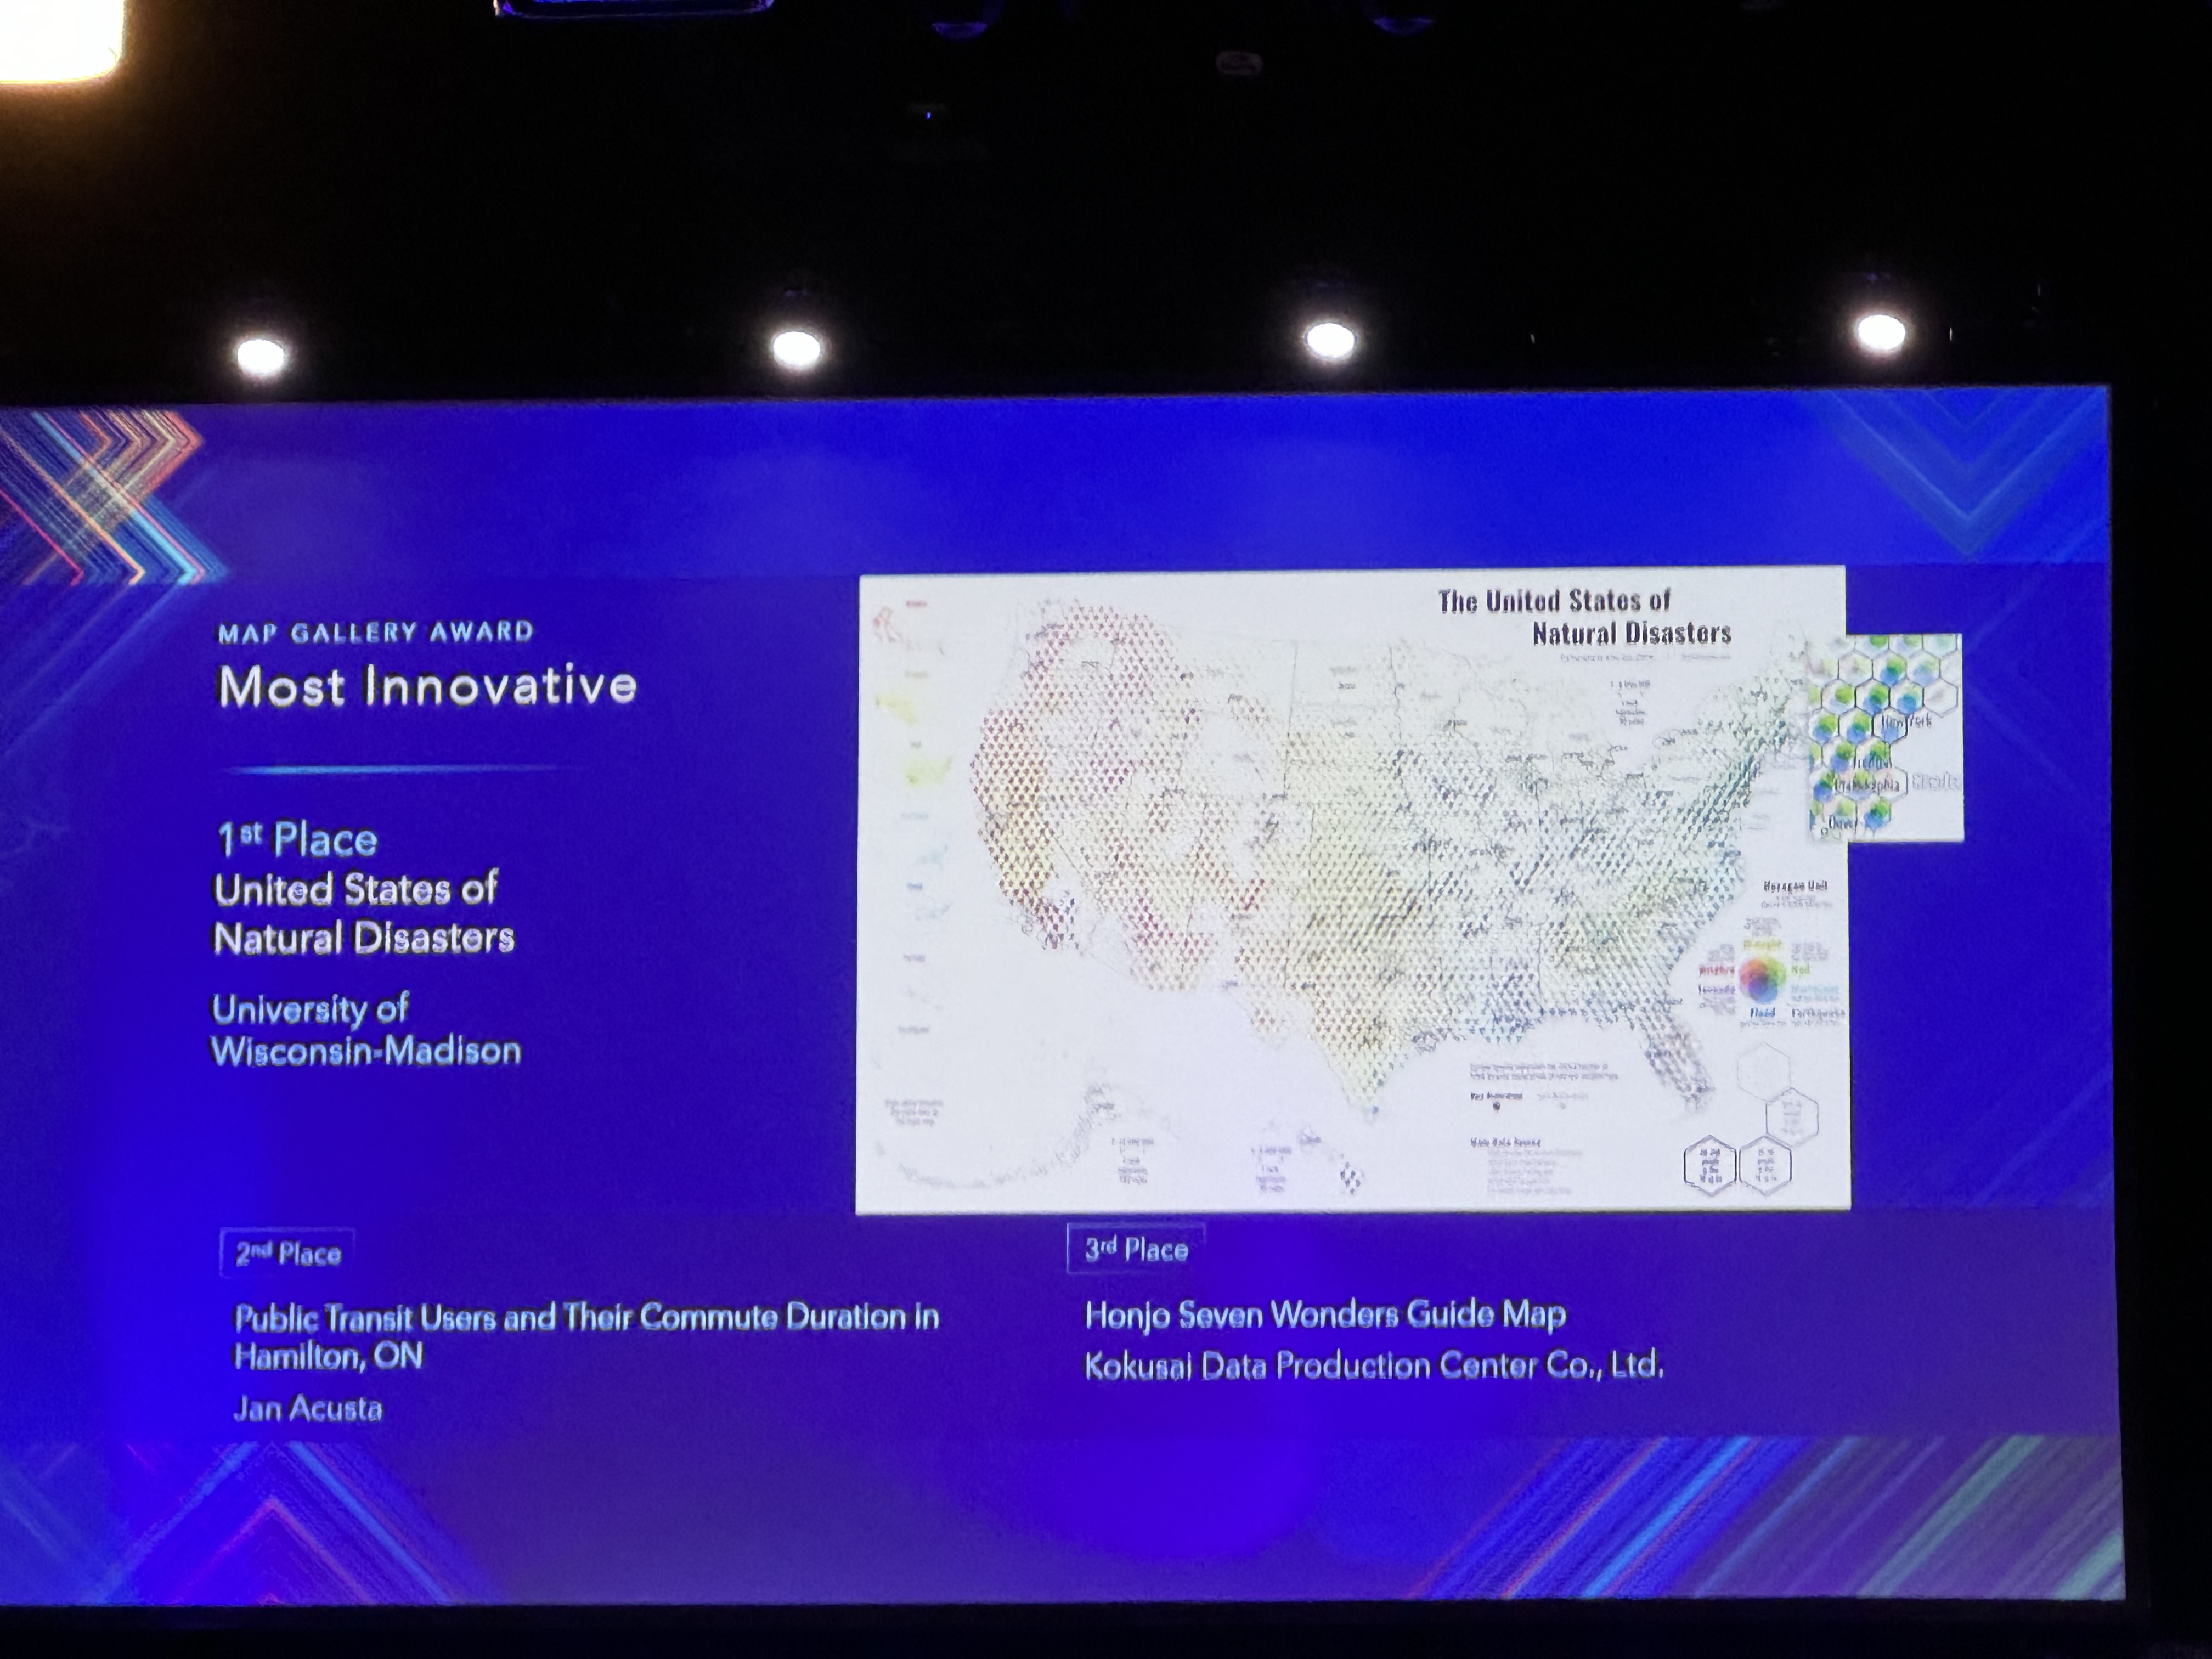
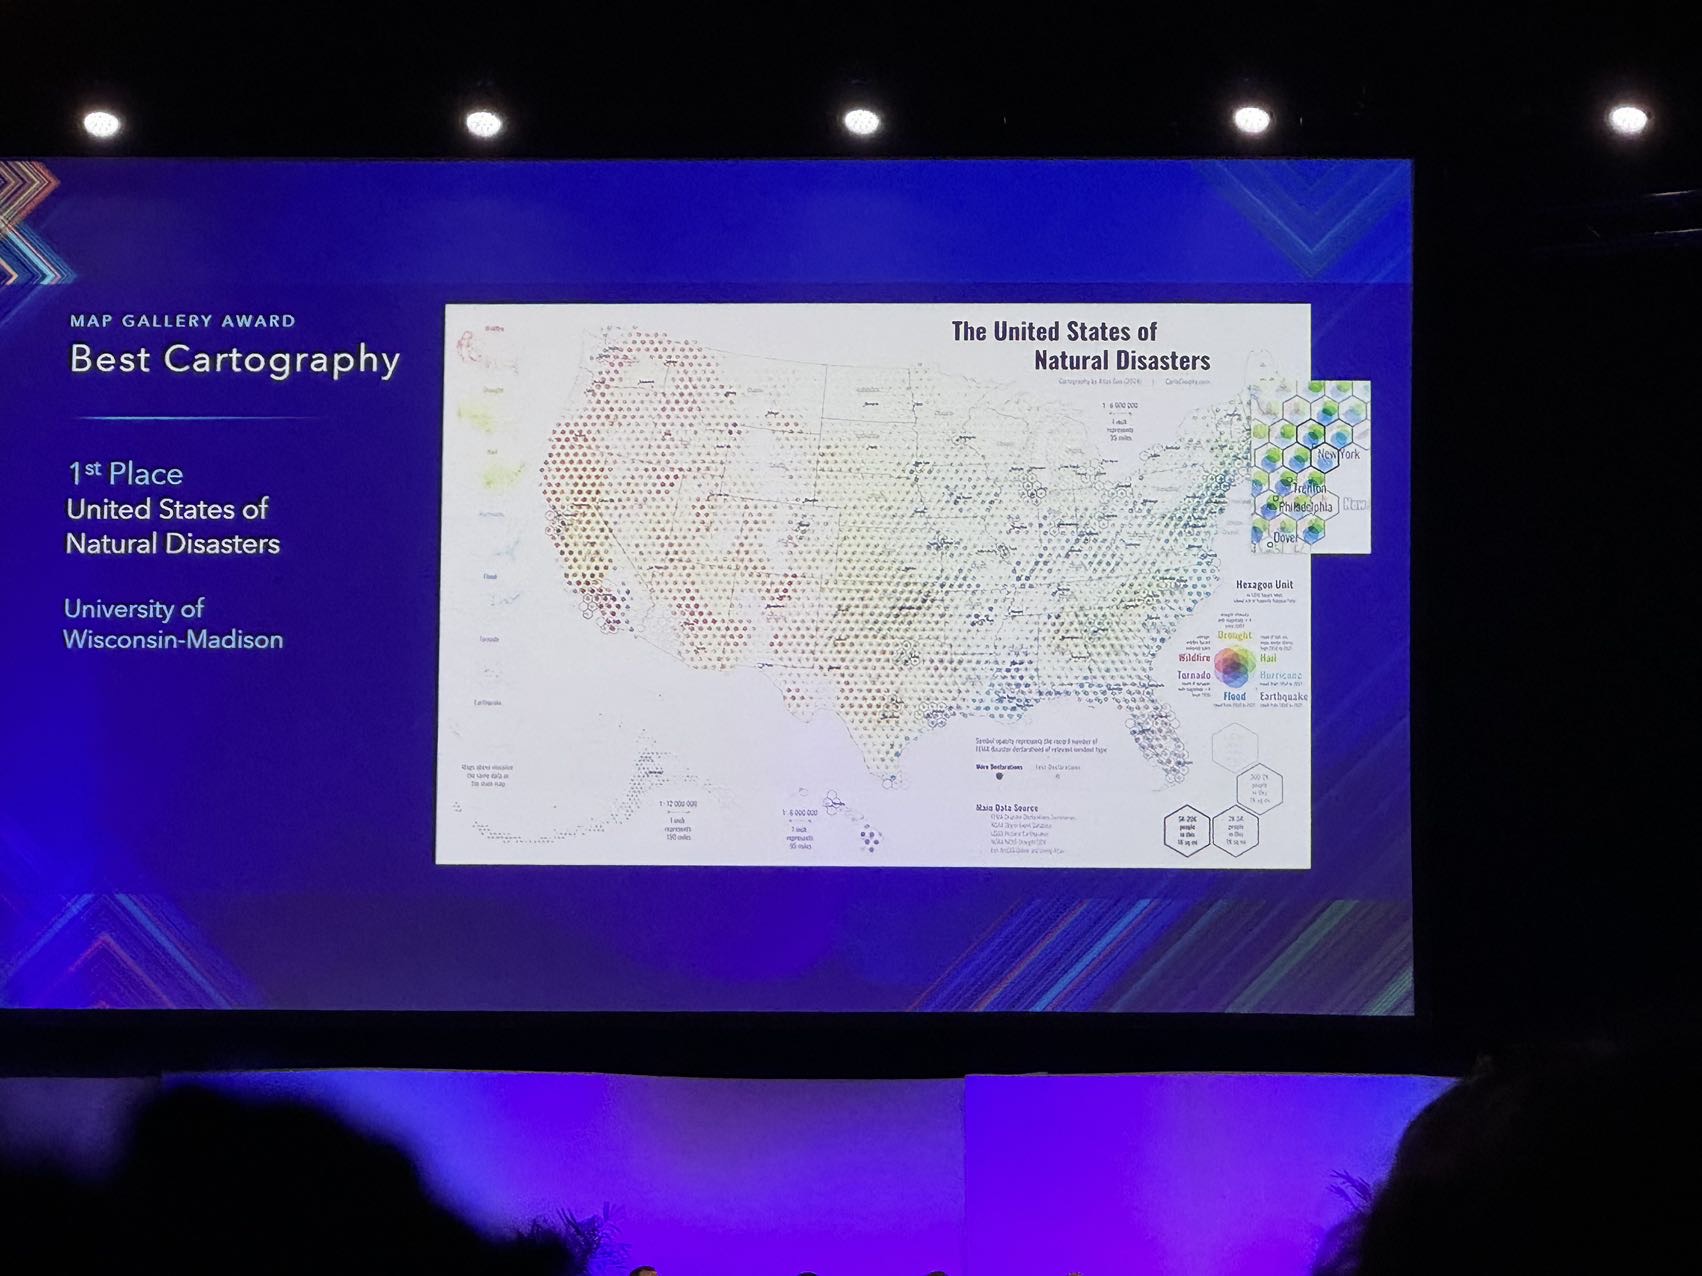
In July 2024, this map won the 1st place of "Most Innovative Map" and the Best Cartography Award (the only one) in Esri User Conference 2024. Check it out from the Virtual Map Gallery and the Map Gallery Award Winners.

"MAPS.COM" is a website owned and supported by Esri. It highlights interesting, impactful, and beautiful maps that help people better understand the world. In late July 2024, this map is featured on "maps.com" in "Living Planet" Section: https://www.maps.com/the-united-states-of-natural-disasters/, followed by a "Back to the Map" interview article.
In September 2024, this map won the Highly Commended Award of
Collins Bartholomew Award
for Thematic Mapping & Infographics, by British Cartographic Society.

A printed version of this map was displayed in the Map Gallery of North American Cartographic Information Society 2024 Annual Conference at Tacoma, Washington, and won the Best Research Map award in the Student Map and Poster Competition.