Global Climate Patterns
Multivariate mapping of global climate using WorldClim dataset
 Download Compressed Image
Download Full-Size Image
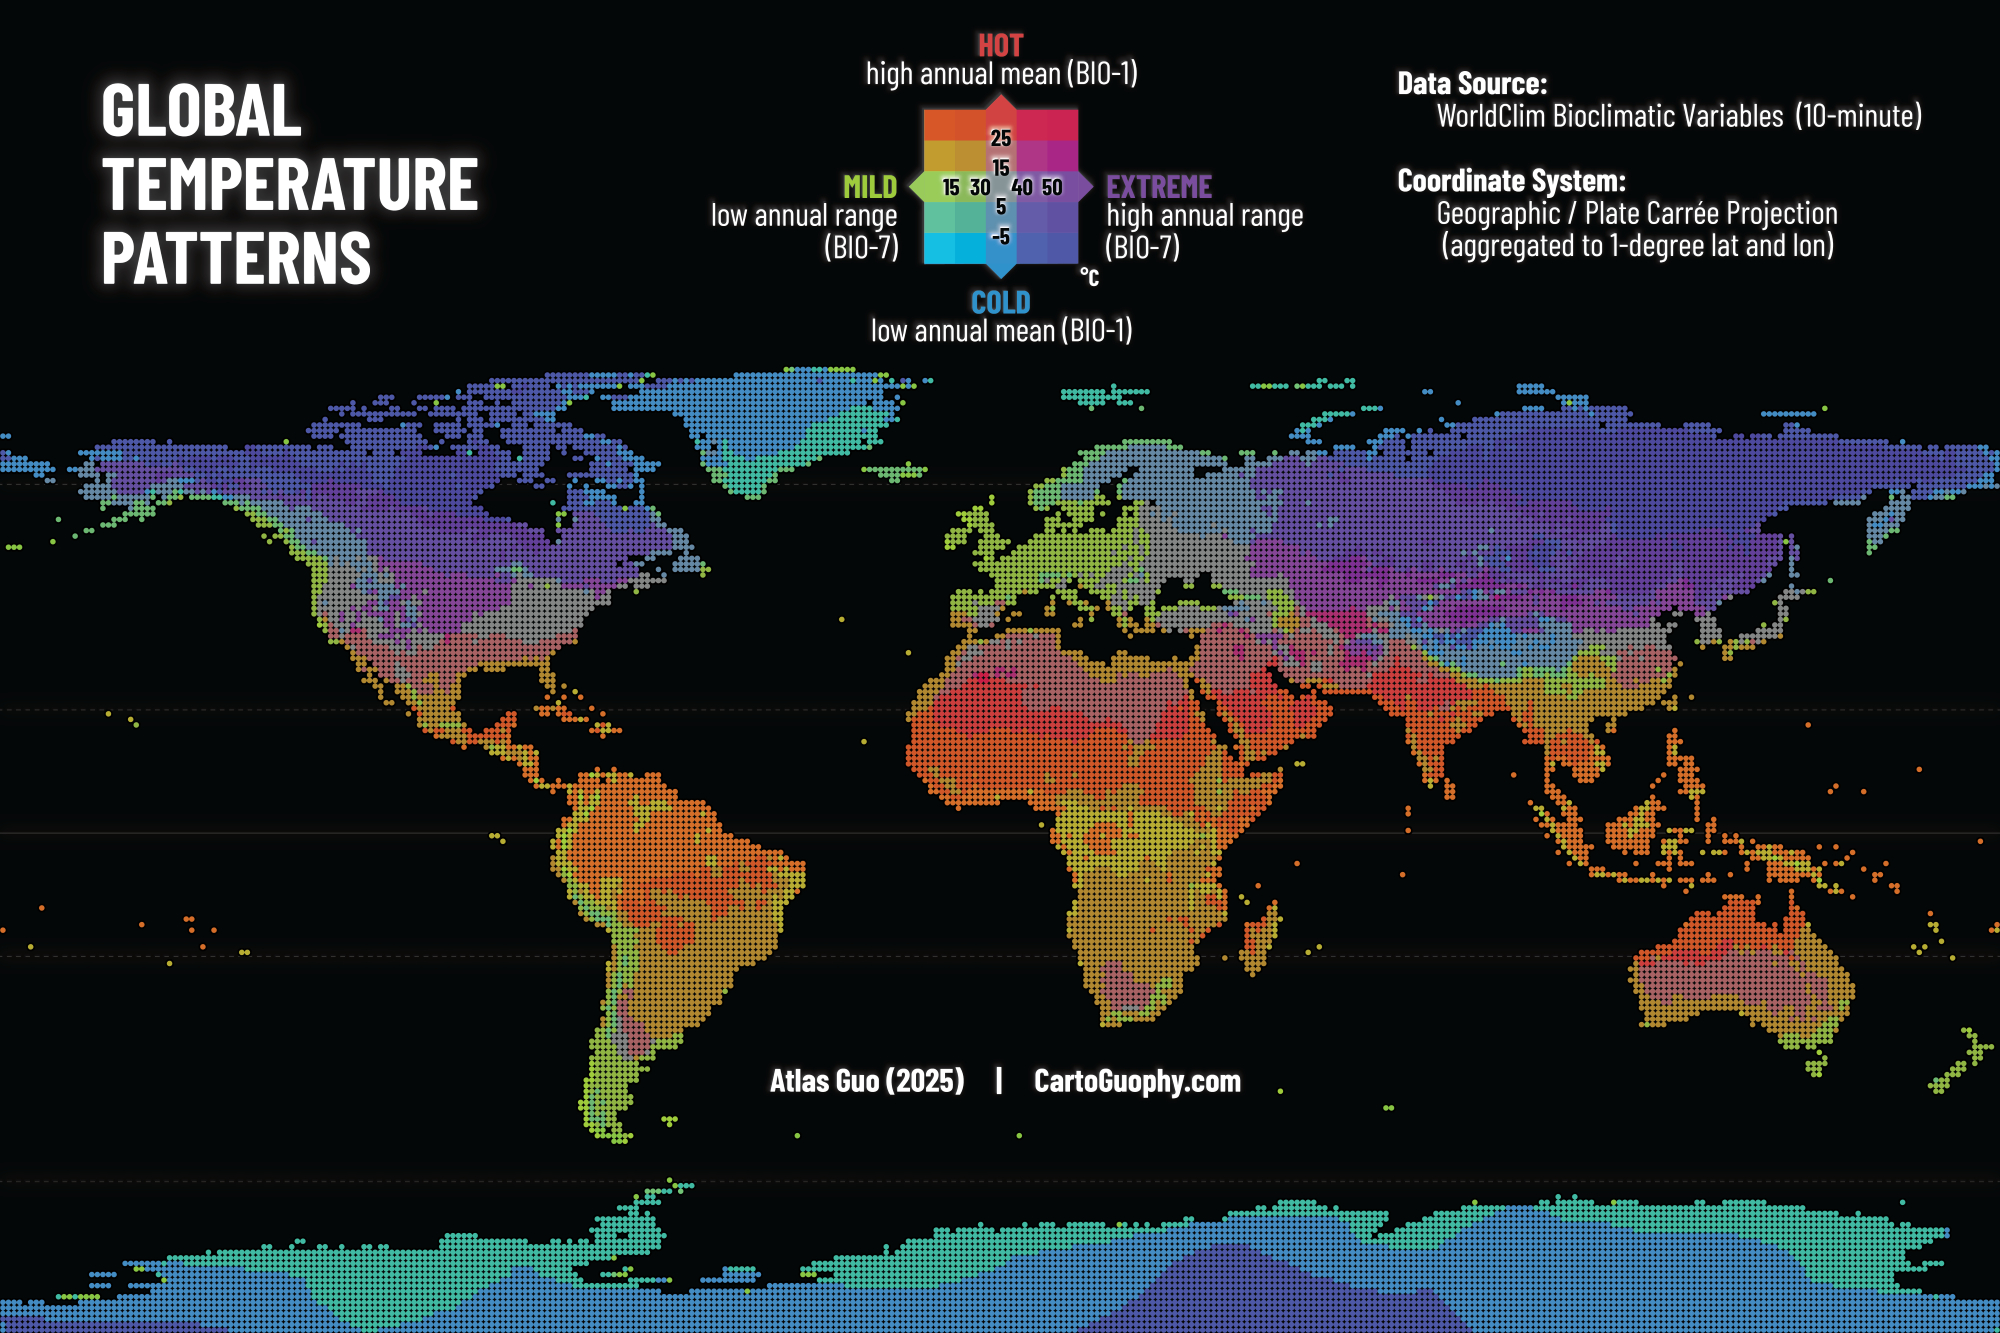
This map illustrates global temperature patterns based on WorldClim bioclimatic variables. It classifies the world’s land areas according to their long-term thermal characteristics, combining annual mean temperature (BIO-1) and annual temperature range (BIO-7). Data were aggregated to a 1-degree grid using a Plate Carrée projection (geographic coordinates).
This map was displayed in the map gallery (postcard / tiny map) of North American Cartographic Information Society (NACIS) 2025 annual meeting at Louisiville, KY (Oct 15-17). Check out my other entries in the map gallery!
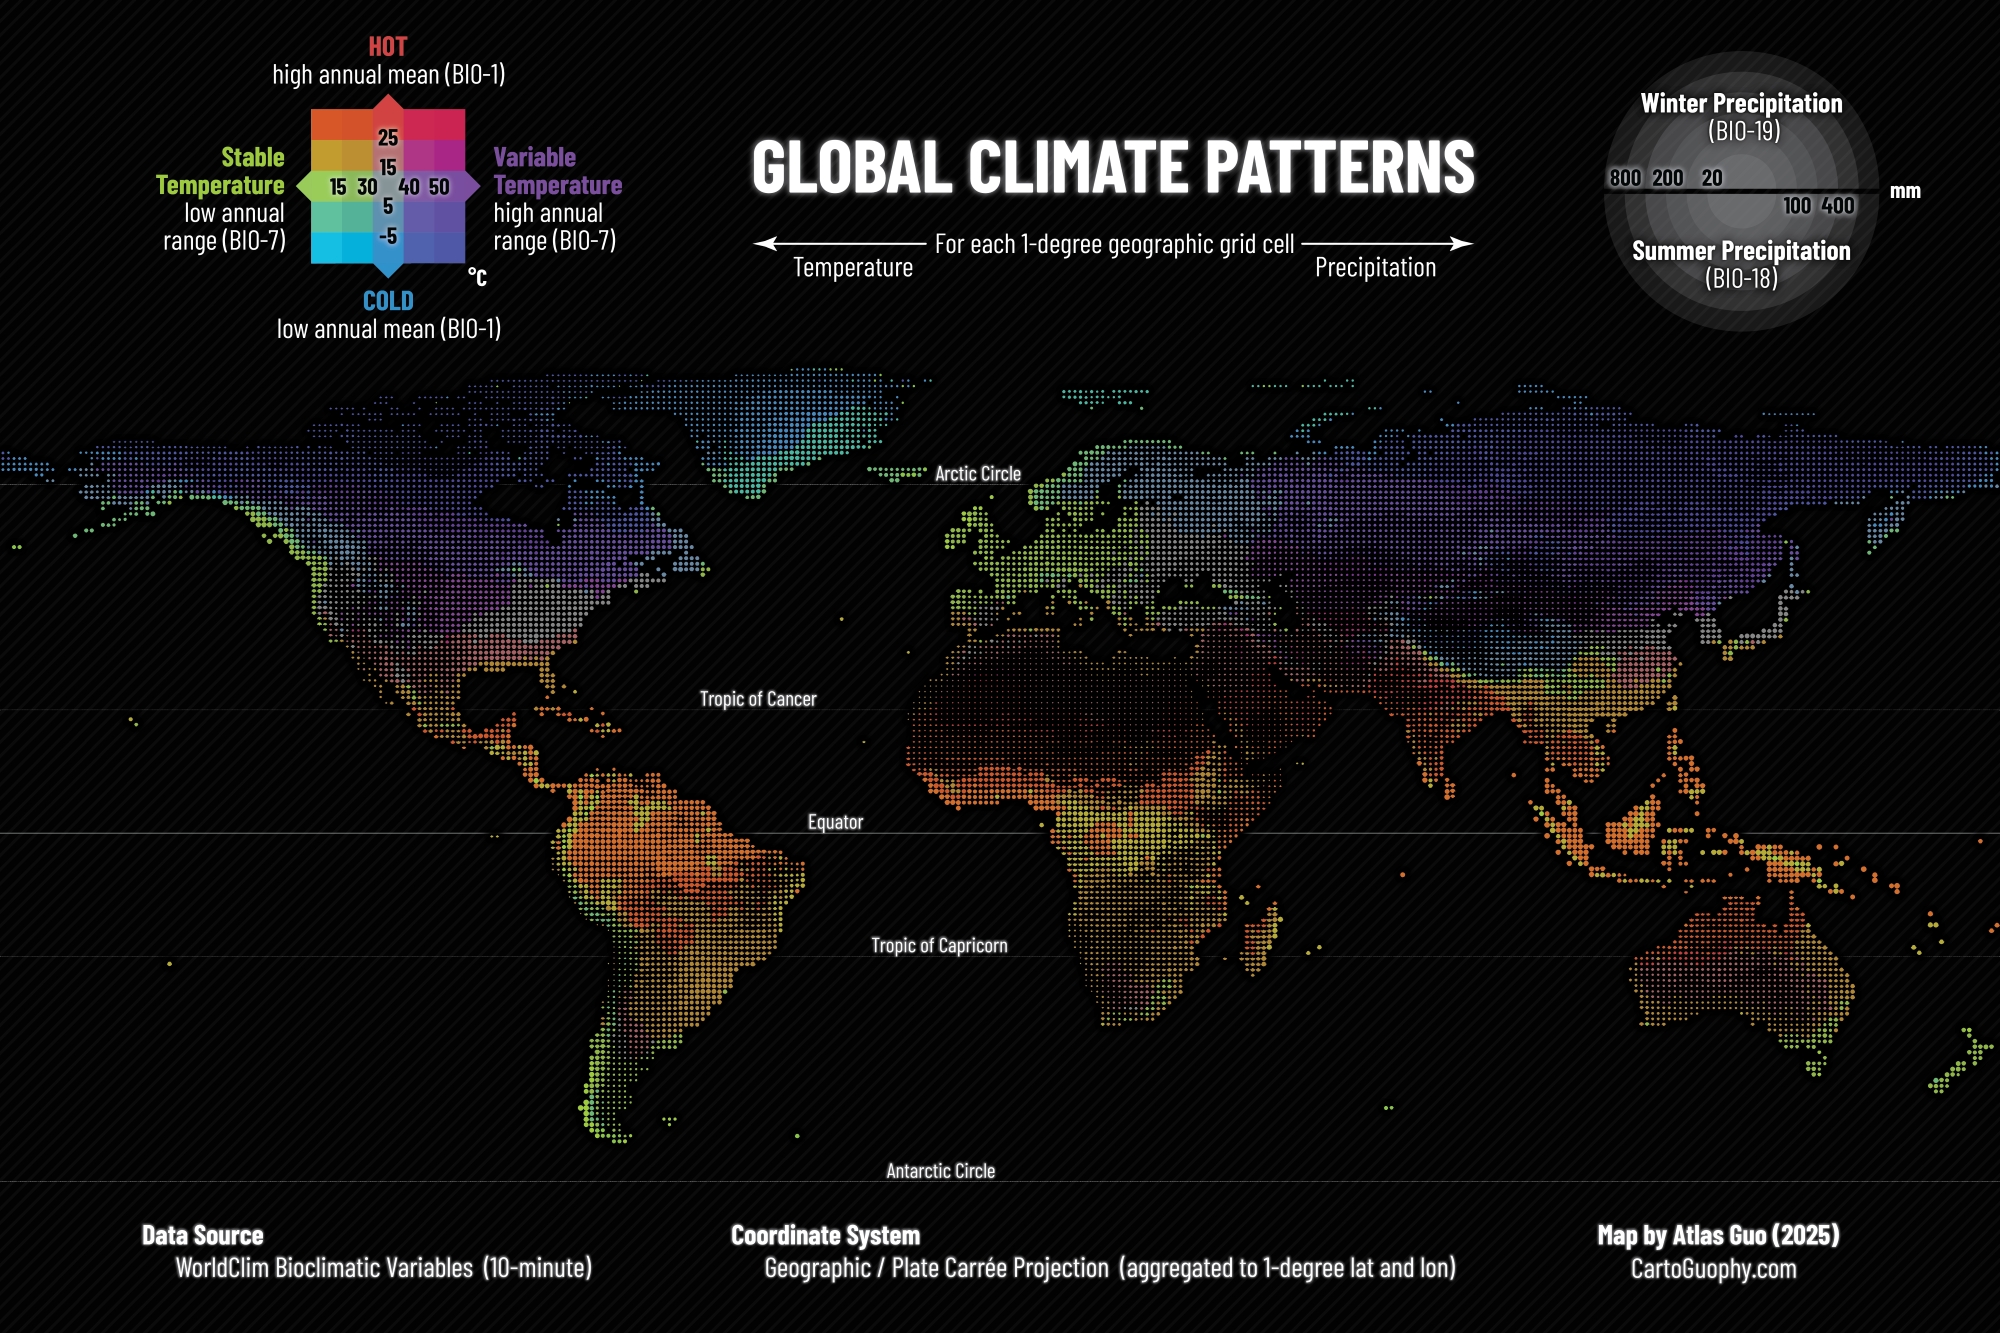
In this version, I added precipitation variables, precipitation of the hottest quarter (BIO18) and precipitation of the coldest quarter (BIO19). When designing the original bivariate temperature map, I intentionally encoded temperature using only color hue and saturation while maintaining nearly constant lightness, thereby reserving the lightness dimension conceptually so that precipitation could be introduced through symbol size without perceptual ambiguity. Precipitation is thus represented by the size of semicircles rather than additional color variation, with the upper semicircle indicating winter and the lower semicircle indicating summer, allowing symbol size to assume a role analogous to lightness while keeping the temperature and precipitation dimensions visually distinct.
 Download Compressed Image
Download Full-Size Image