Historical Hurricane Tracks in Contiguous United States
An updated continuation of Visualizing Historical Hurricanes in Continuous U.S
 Download Compressed Image
Download Full-Size Image
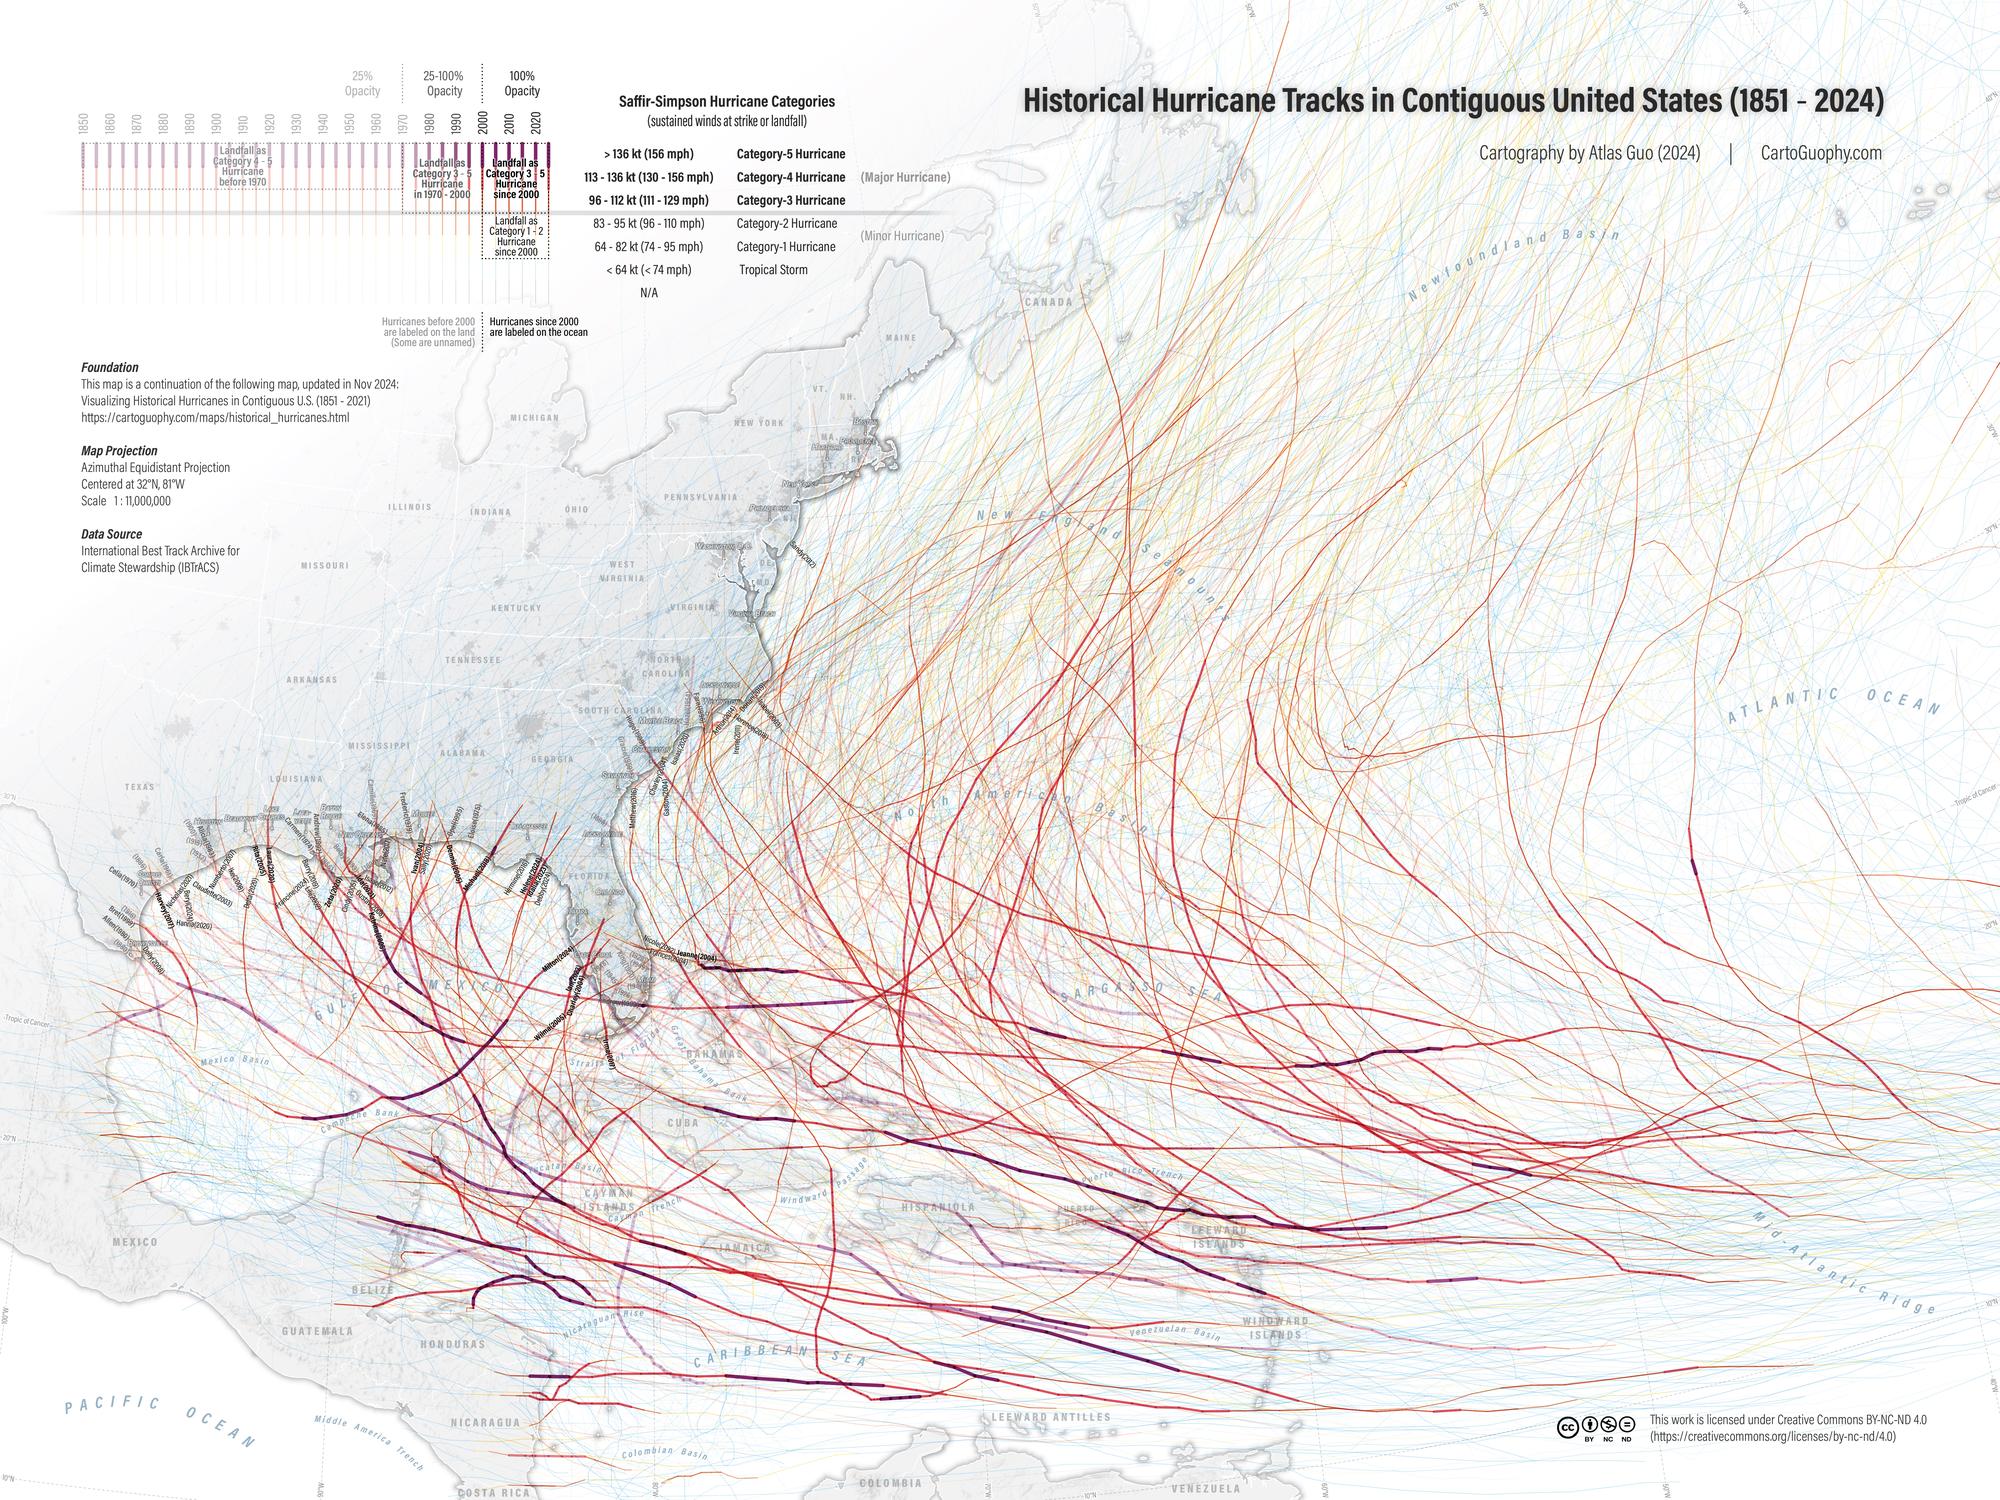
This map product visualizes the tracks of historical hurricanes in contiguous U.S. from 1851 to 2024. It
is a continuation of my previous award-winning map
Visualizing Historical
Hurricanes in Continuous U.S, with revised legend design and updated dataset.
With all the hurricane tracks’ intensity displayed in different color-width combination, as illustrated
in the legend, the storm category (Saffir-Simpson Hurricane Wind) is
intuitively visualized at corresponding location of tracks. Storms since 2020 have full opacity, and
various transparency is applied to the older ones according to the year,
imitating the fading out history, while storms before 1970 are universally grayed out with only 25%
opacity. As for the label typography, bold text illustrates major hurricanes
(category-3 and above); hurricanes since 2000 are labeled on the ocean, and those before are labeled on
the land, including some named storms.
Additionally, auxiliary elements (graticule, country boundary, state boundary, hillshading, urban area)
and graphic designs are deployed for visual legibility and cartographic
aesthetics.
The major data source is the International Best Track Archive for Climate Stewardship (IBTrACS) during
1851 - 2024, providing the location and intensity for global tropical cyclones.
Additional data sources include U.S. Census Bureau, ArcGIS Online, and Esri’s World Ocean Basemap and
Light Gray Basemap.
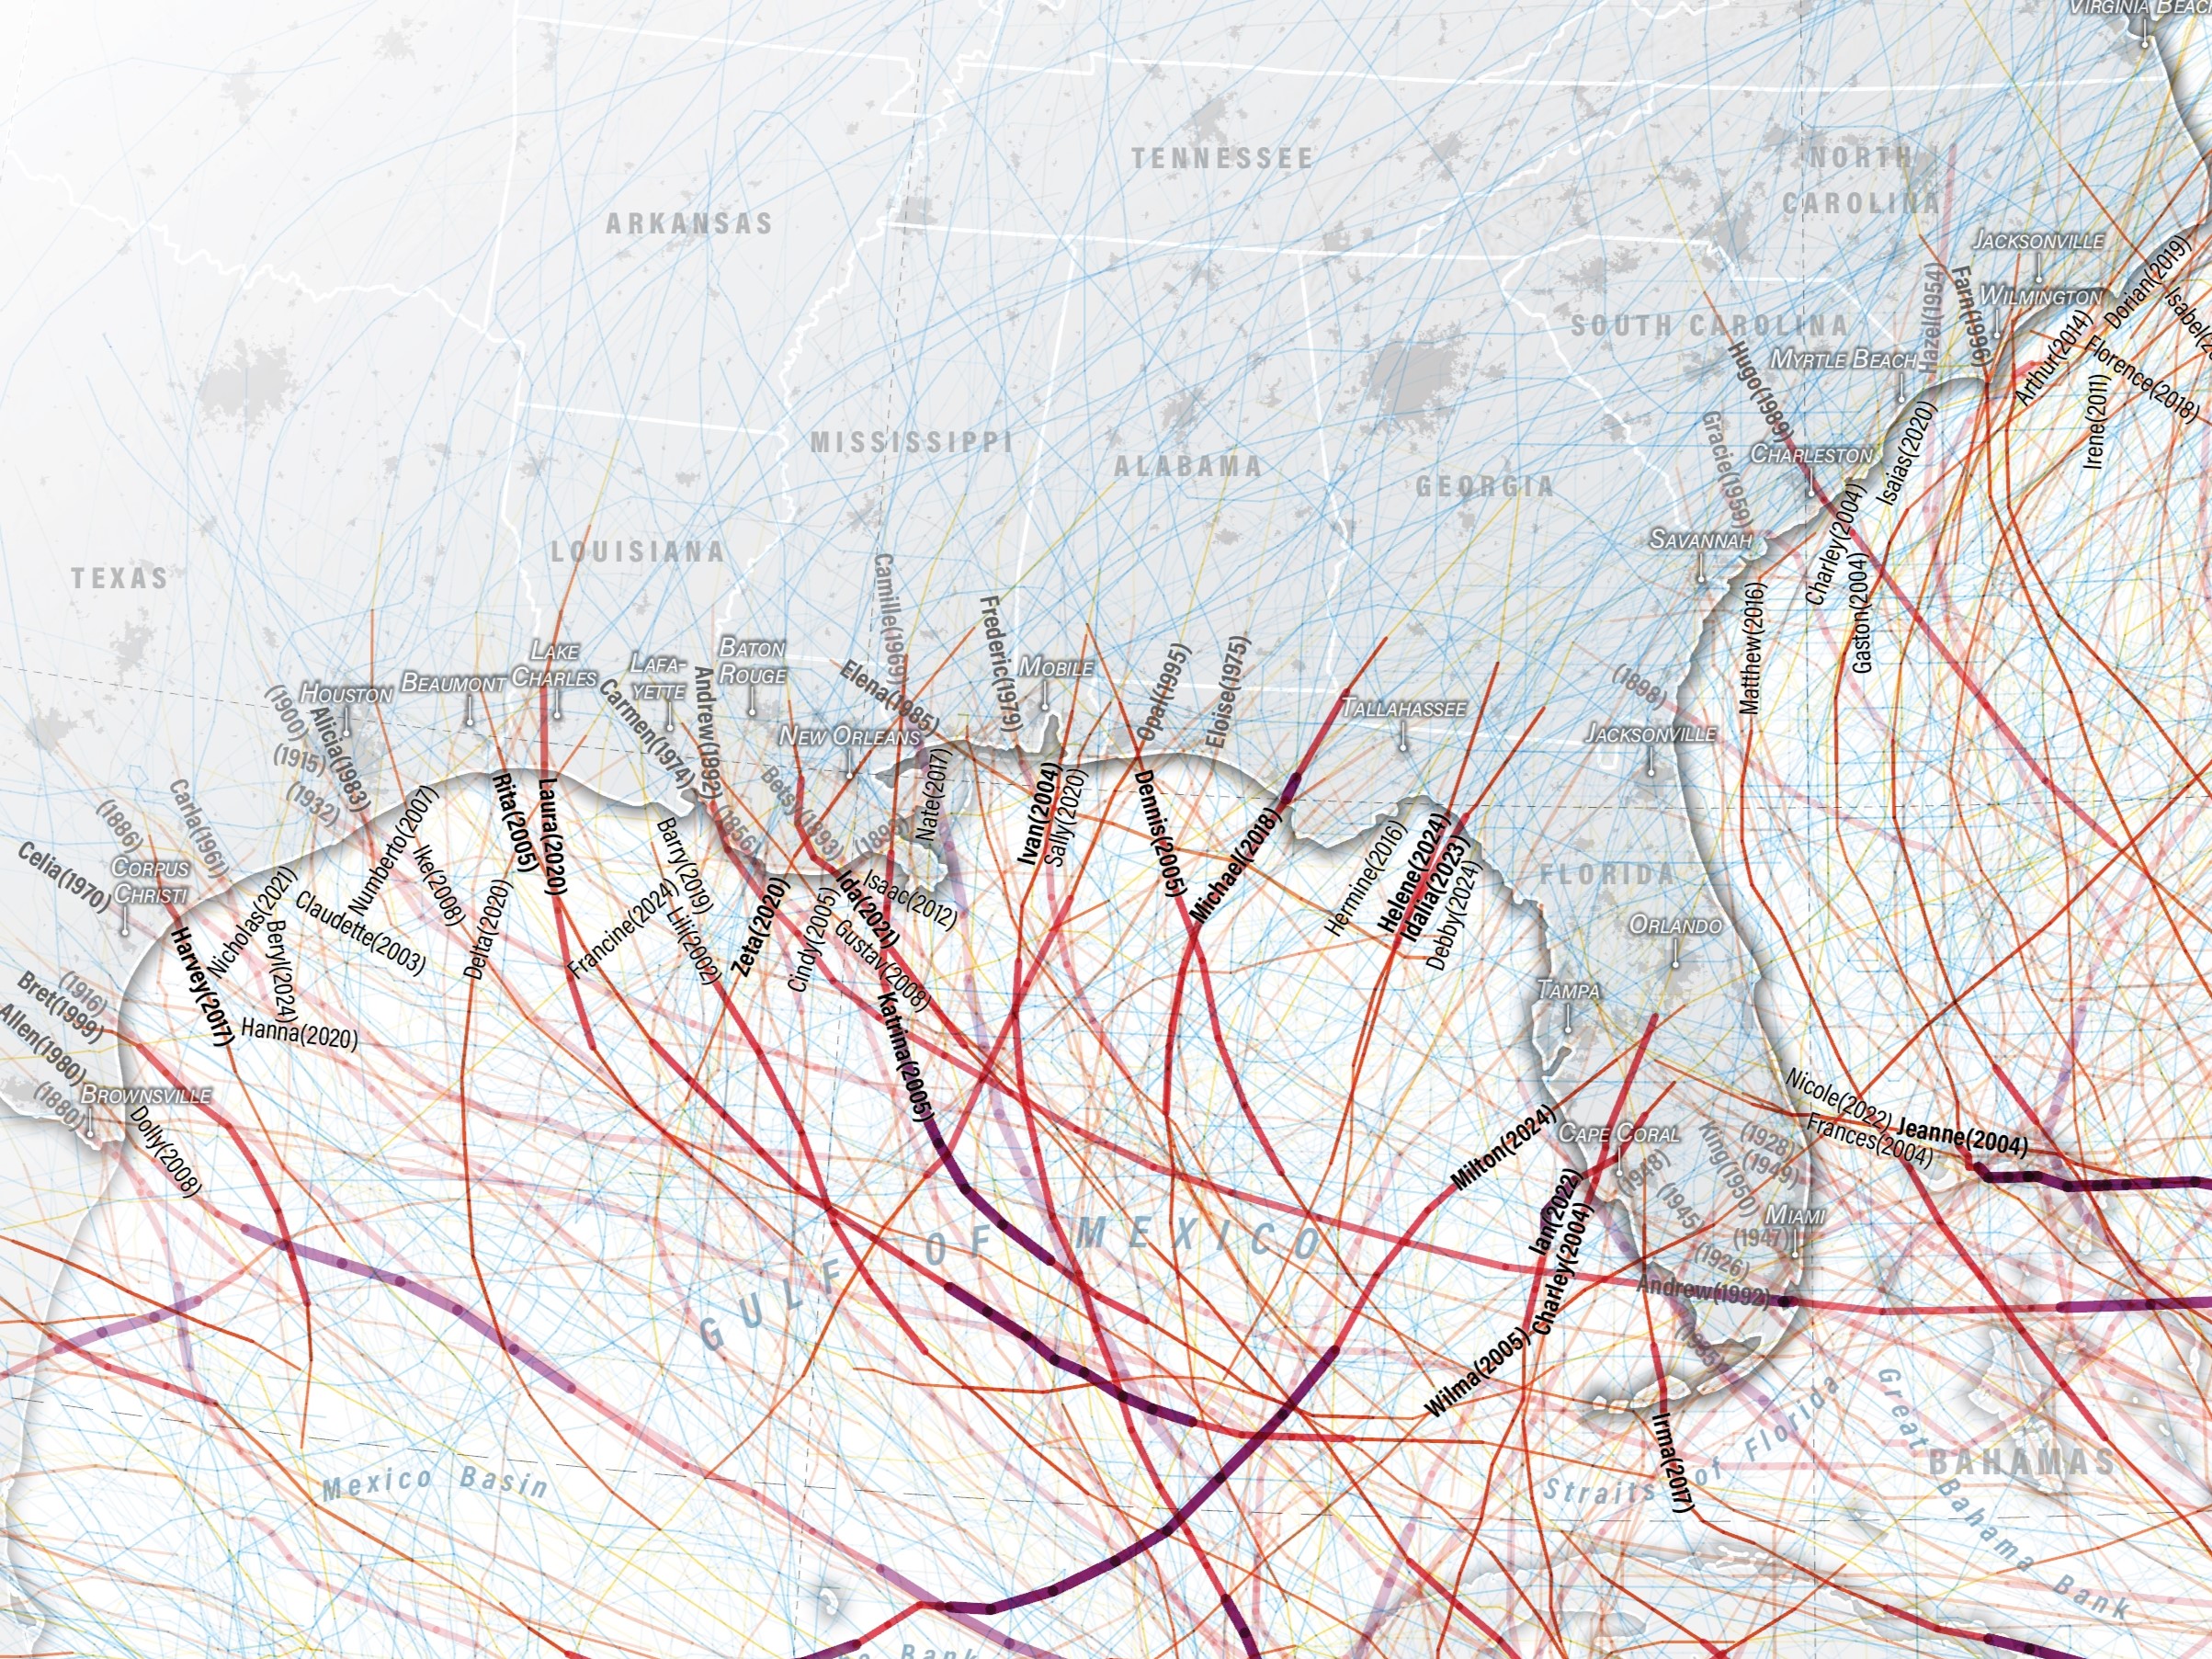
As Hurricane Helene intensifies in late September of 2024, discussions about the disaster preparedness of Florida and Georgia are growing. It reminds me of the map I created two years ago about historical hurricanes, so I expanded the hurricane trajectory section with updated data, including Hurricane Ian (2022) and Idalia (2023). Hope people in the affected areas could learn from the past experiences to better handle the upcoming challenges. Pray for everyone's safety.
On Nov 30, 2024, the National Hurricane Center (NHS) announces the official end of 2024 Atlantic Hurricane Season on Nov 30, with a record-breaking ramp up following a peak-season lull. As the finale, I updated this map with 18 new tracks of storms, and 5 more labels of landed hurricanes: Beryl (Juy), Debby (Aug), Francine (Sep), Helene (Sep), and Milton (Oct), in 2024.
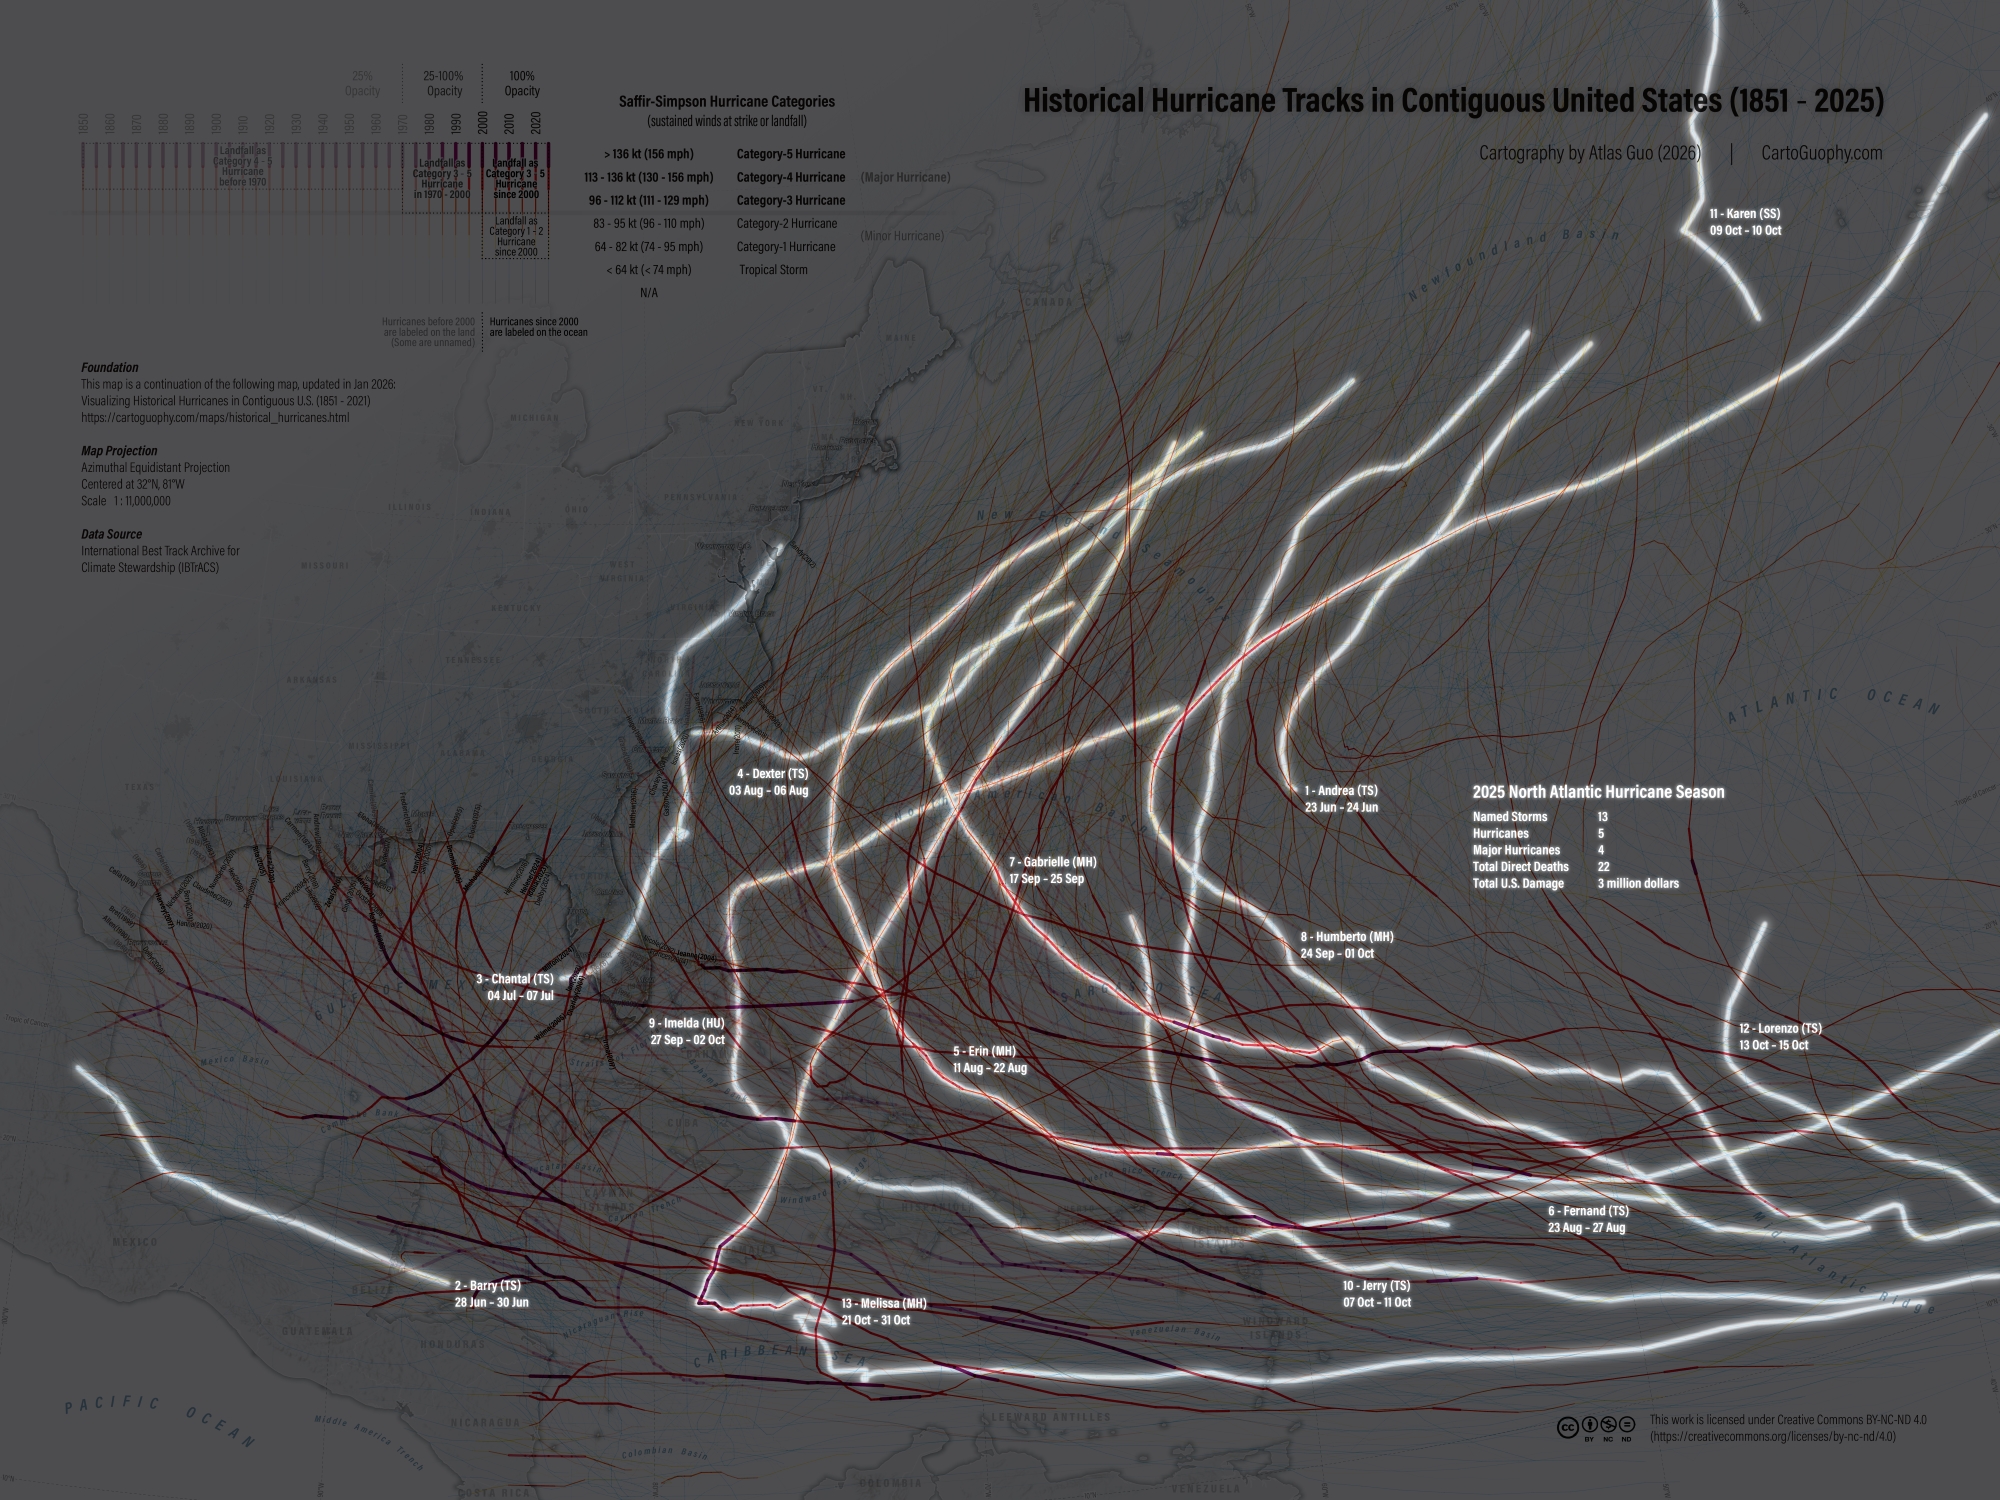
The map below is further updated with the 2025 data, plus a highlighted version. The 2025 Atlantic hurricane season saw no major hurricane make landfall in the United States, but Jamaica was severely impacted by Hurricane Melissa (under this map’s labeling rules, the storm name is not shown, but its tracks are clearly displayed).
 Download Compressed Image
Download Full-Size Image