Live U.S. Wildfire Visualization
Web map visualizing real-time wildfire activity across the U.S. including type and area
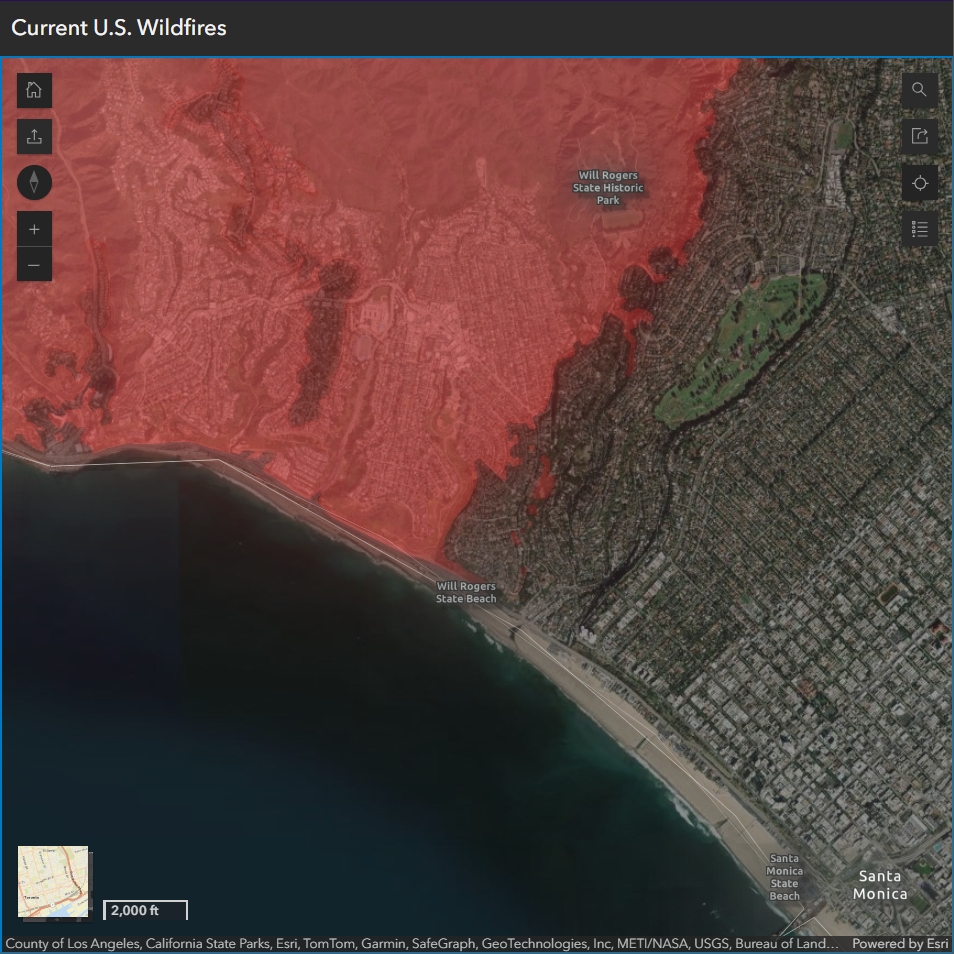
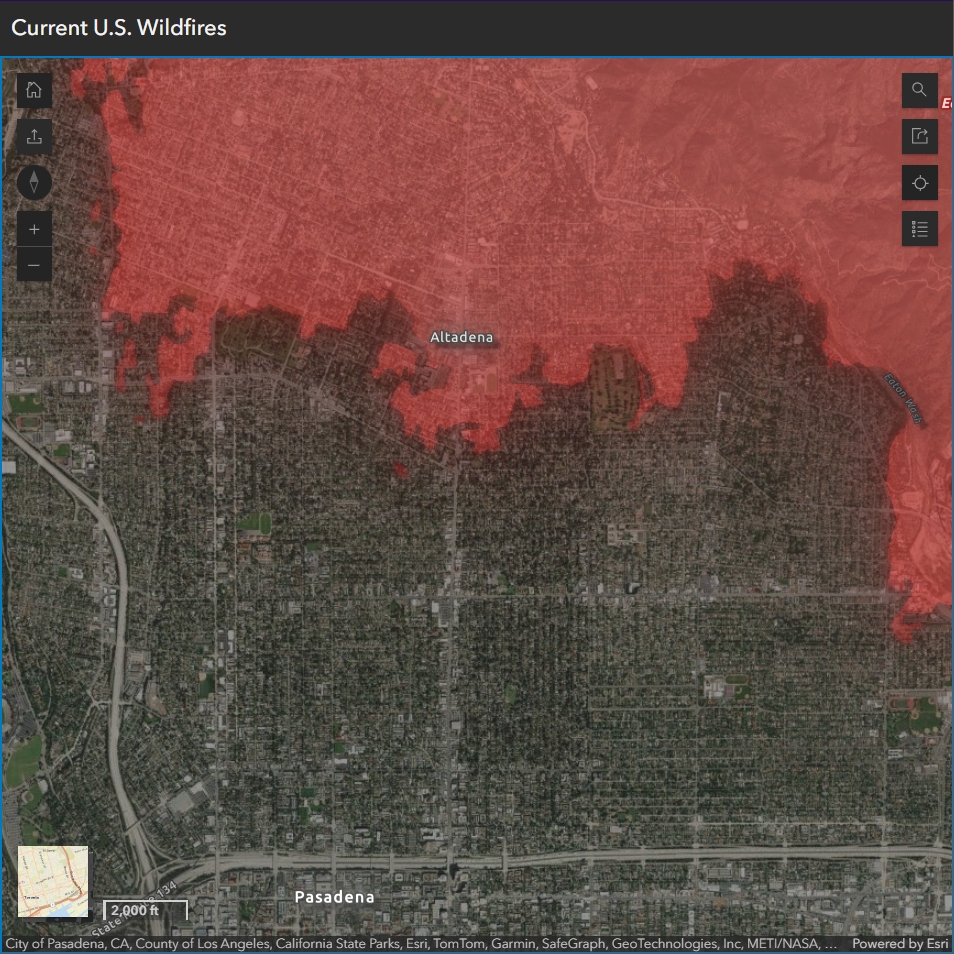
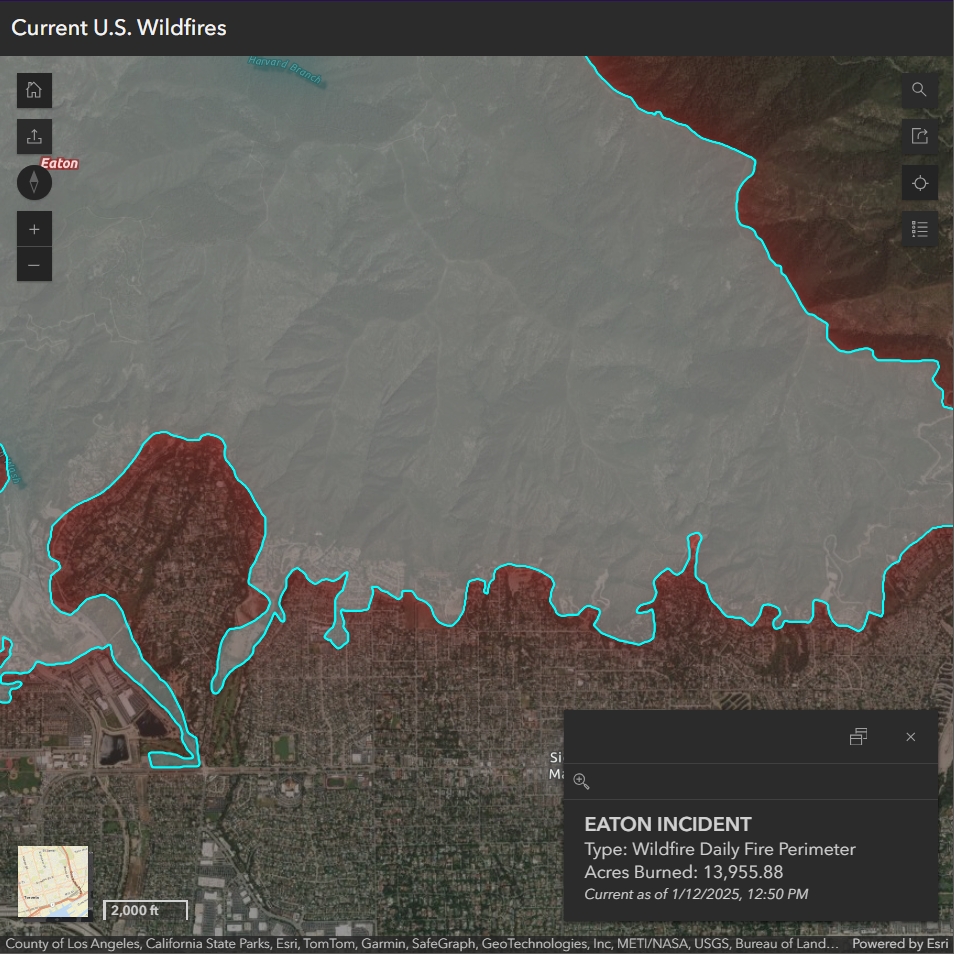
The screenshots below show the wildfire near Los Angeles in January, 2025:
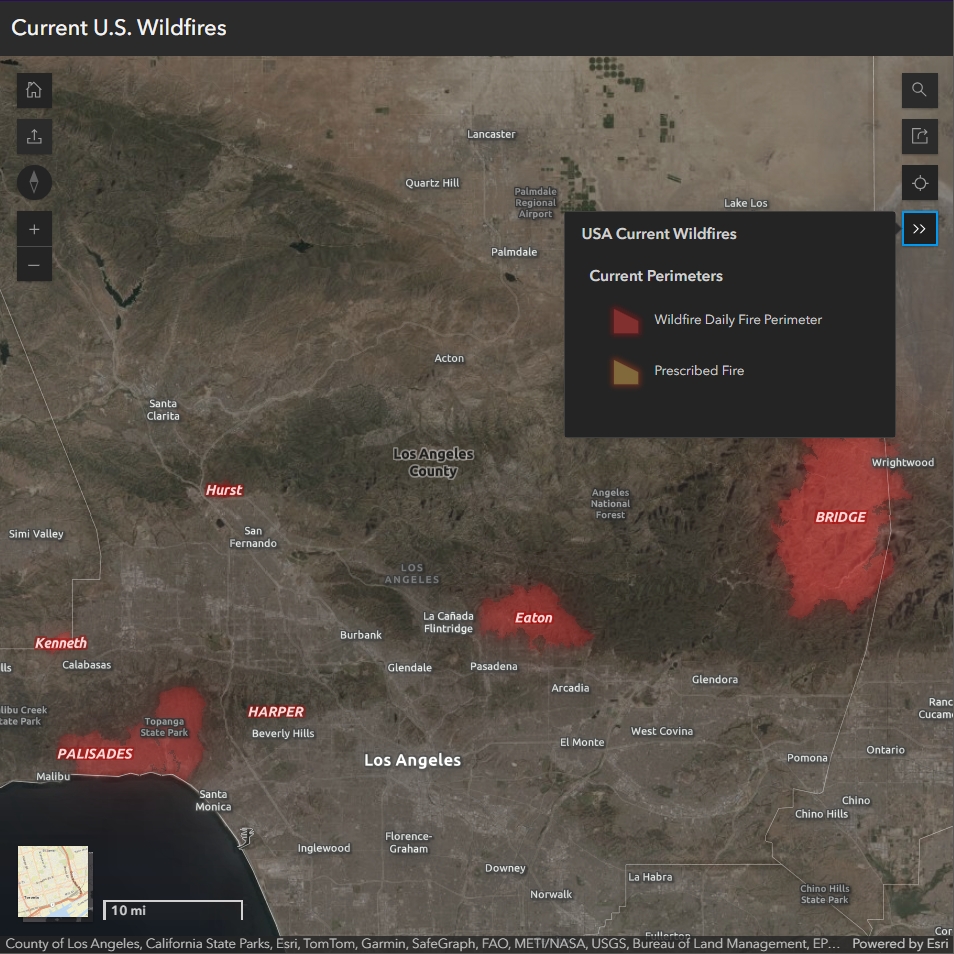
This is a visualization of live wildfire data across the United States, created using ArcGIS Online. The map displays active wildfires, their type, and burnt area in real-time, providing an interactive way to monitor wildfire activity across the country. Click to view the web map.