Visualization of U.S. Power Outage
after the 2026 Winter Storm
A cartographic practice of rapid news mapping after the disaster in
January
2026
Runner-Up of Thematic Map, Wisconsin Land Information Association 2026 Map Contest
 Download Compressed Image
Download Full-Size Image
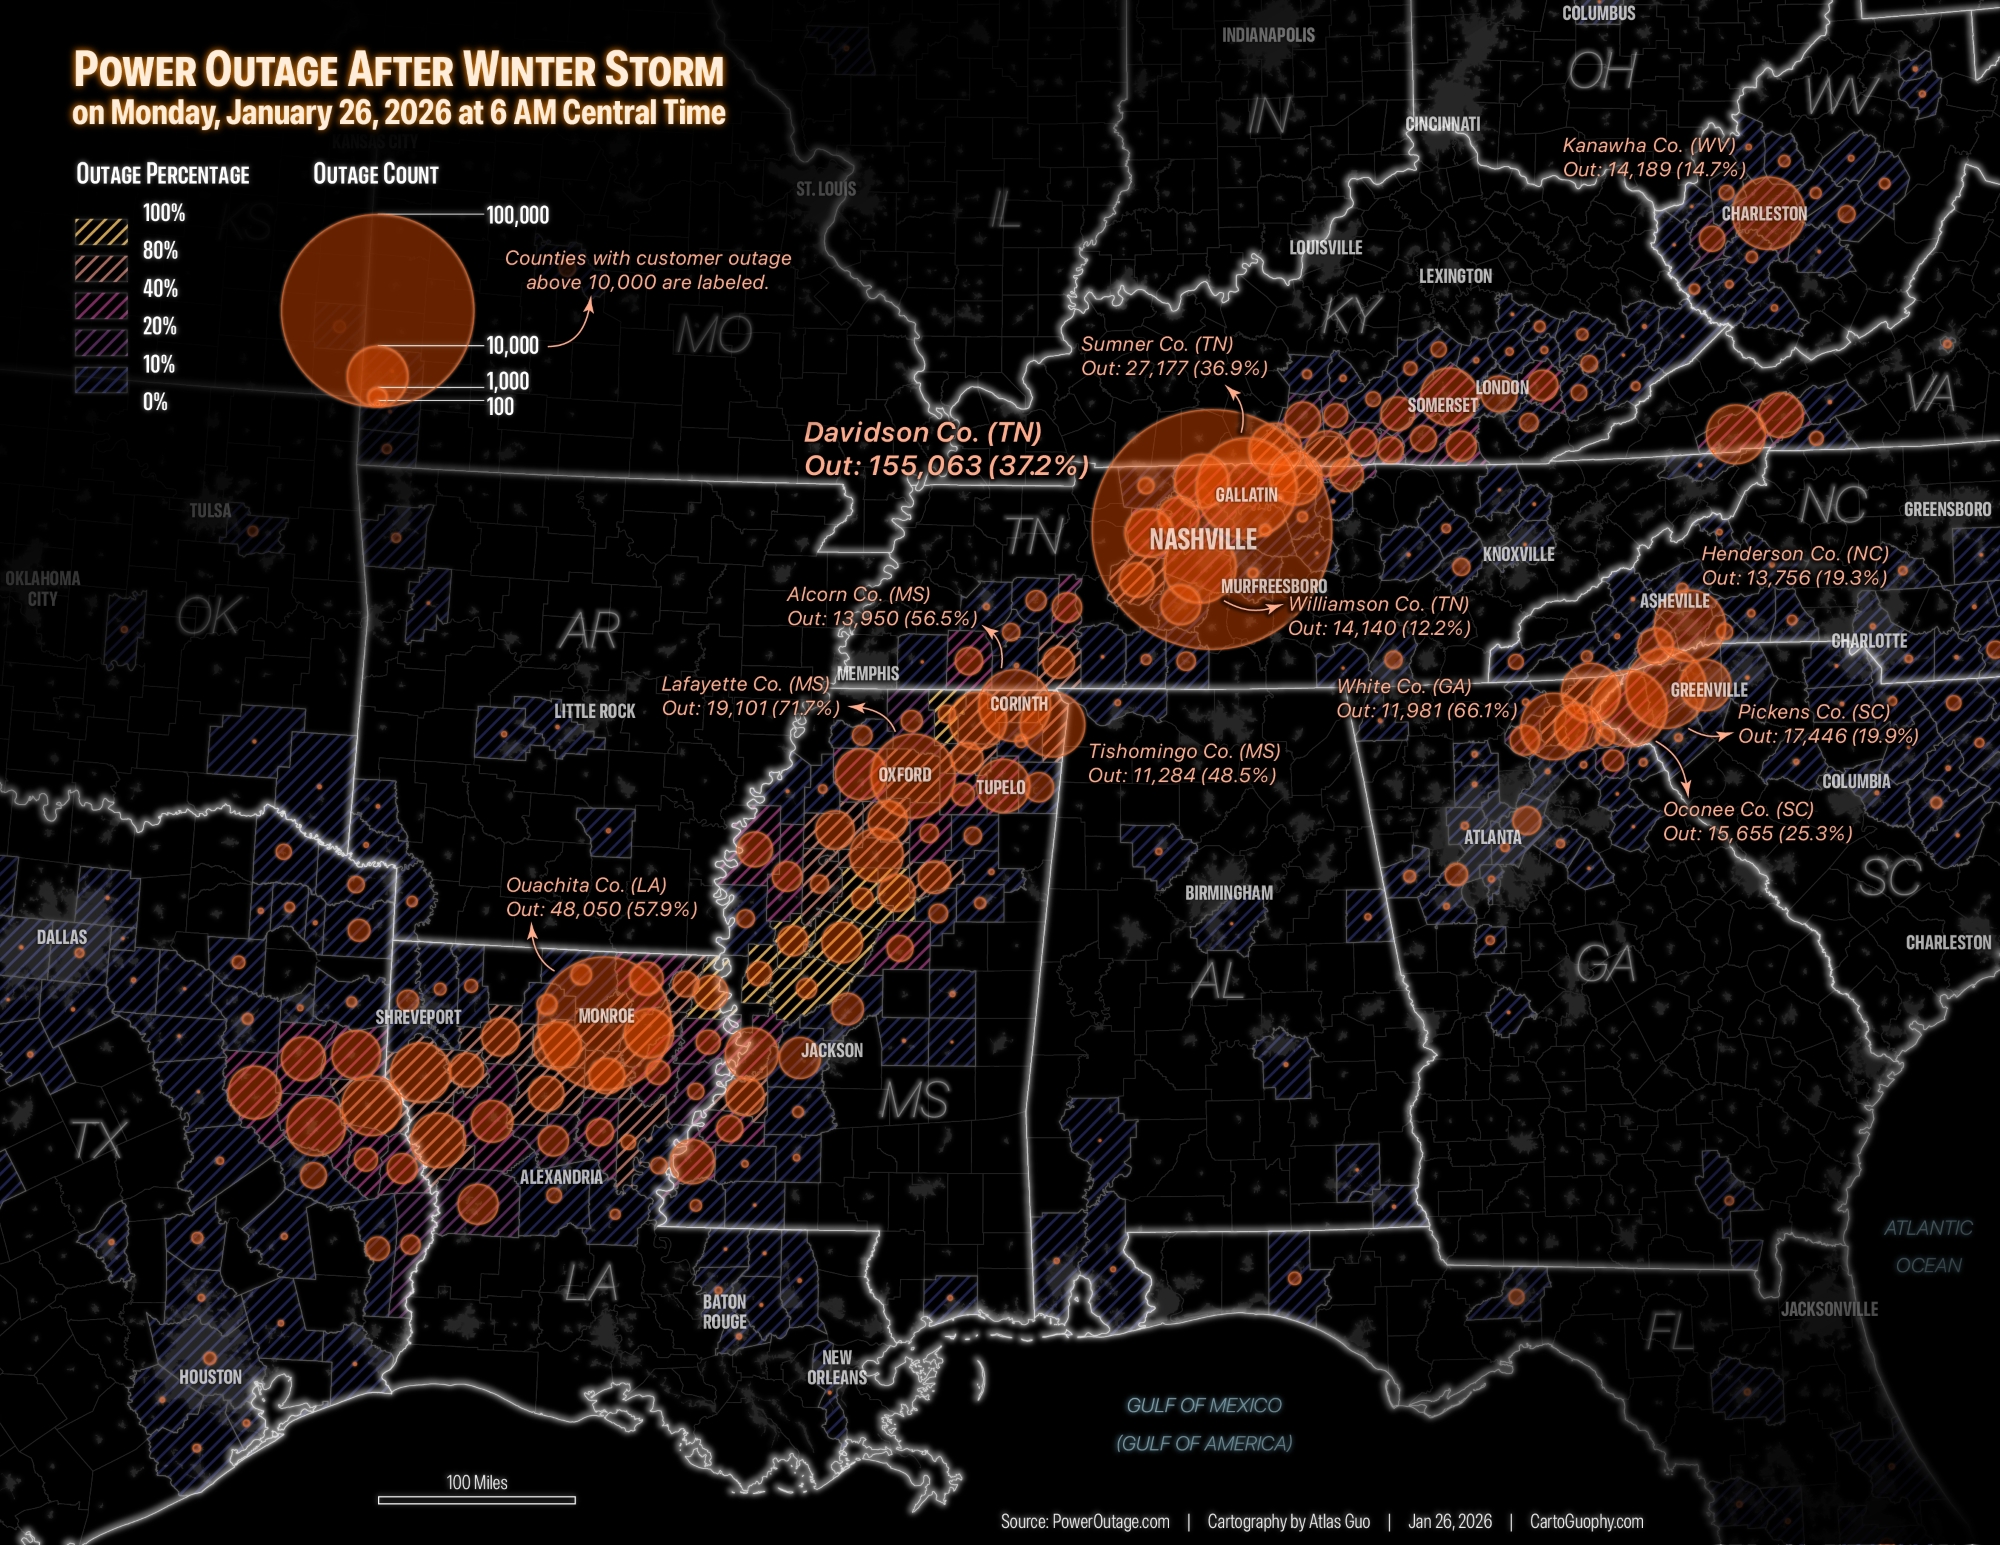
I made a map visualizing the customer count and percentage of power outage as of 6 AM Central Time today (Monday, Jan 26), following the severe winter storm over the weekend. Nashville stands out as the hardest hit area in terms of outage numbers. Data source: PowerOutage.com.
 Download Compressed Image
Download Full-Size Image
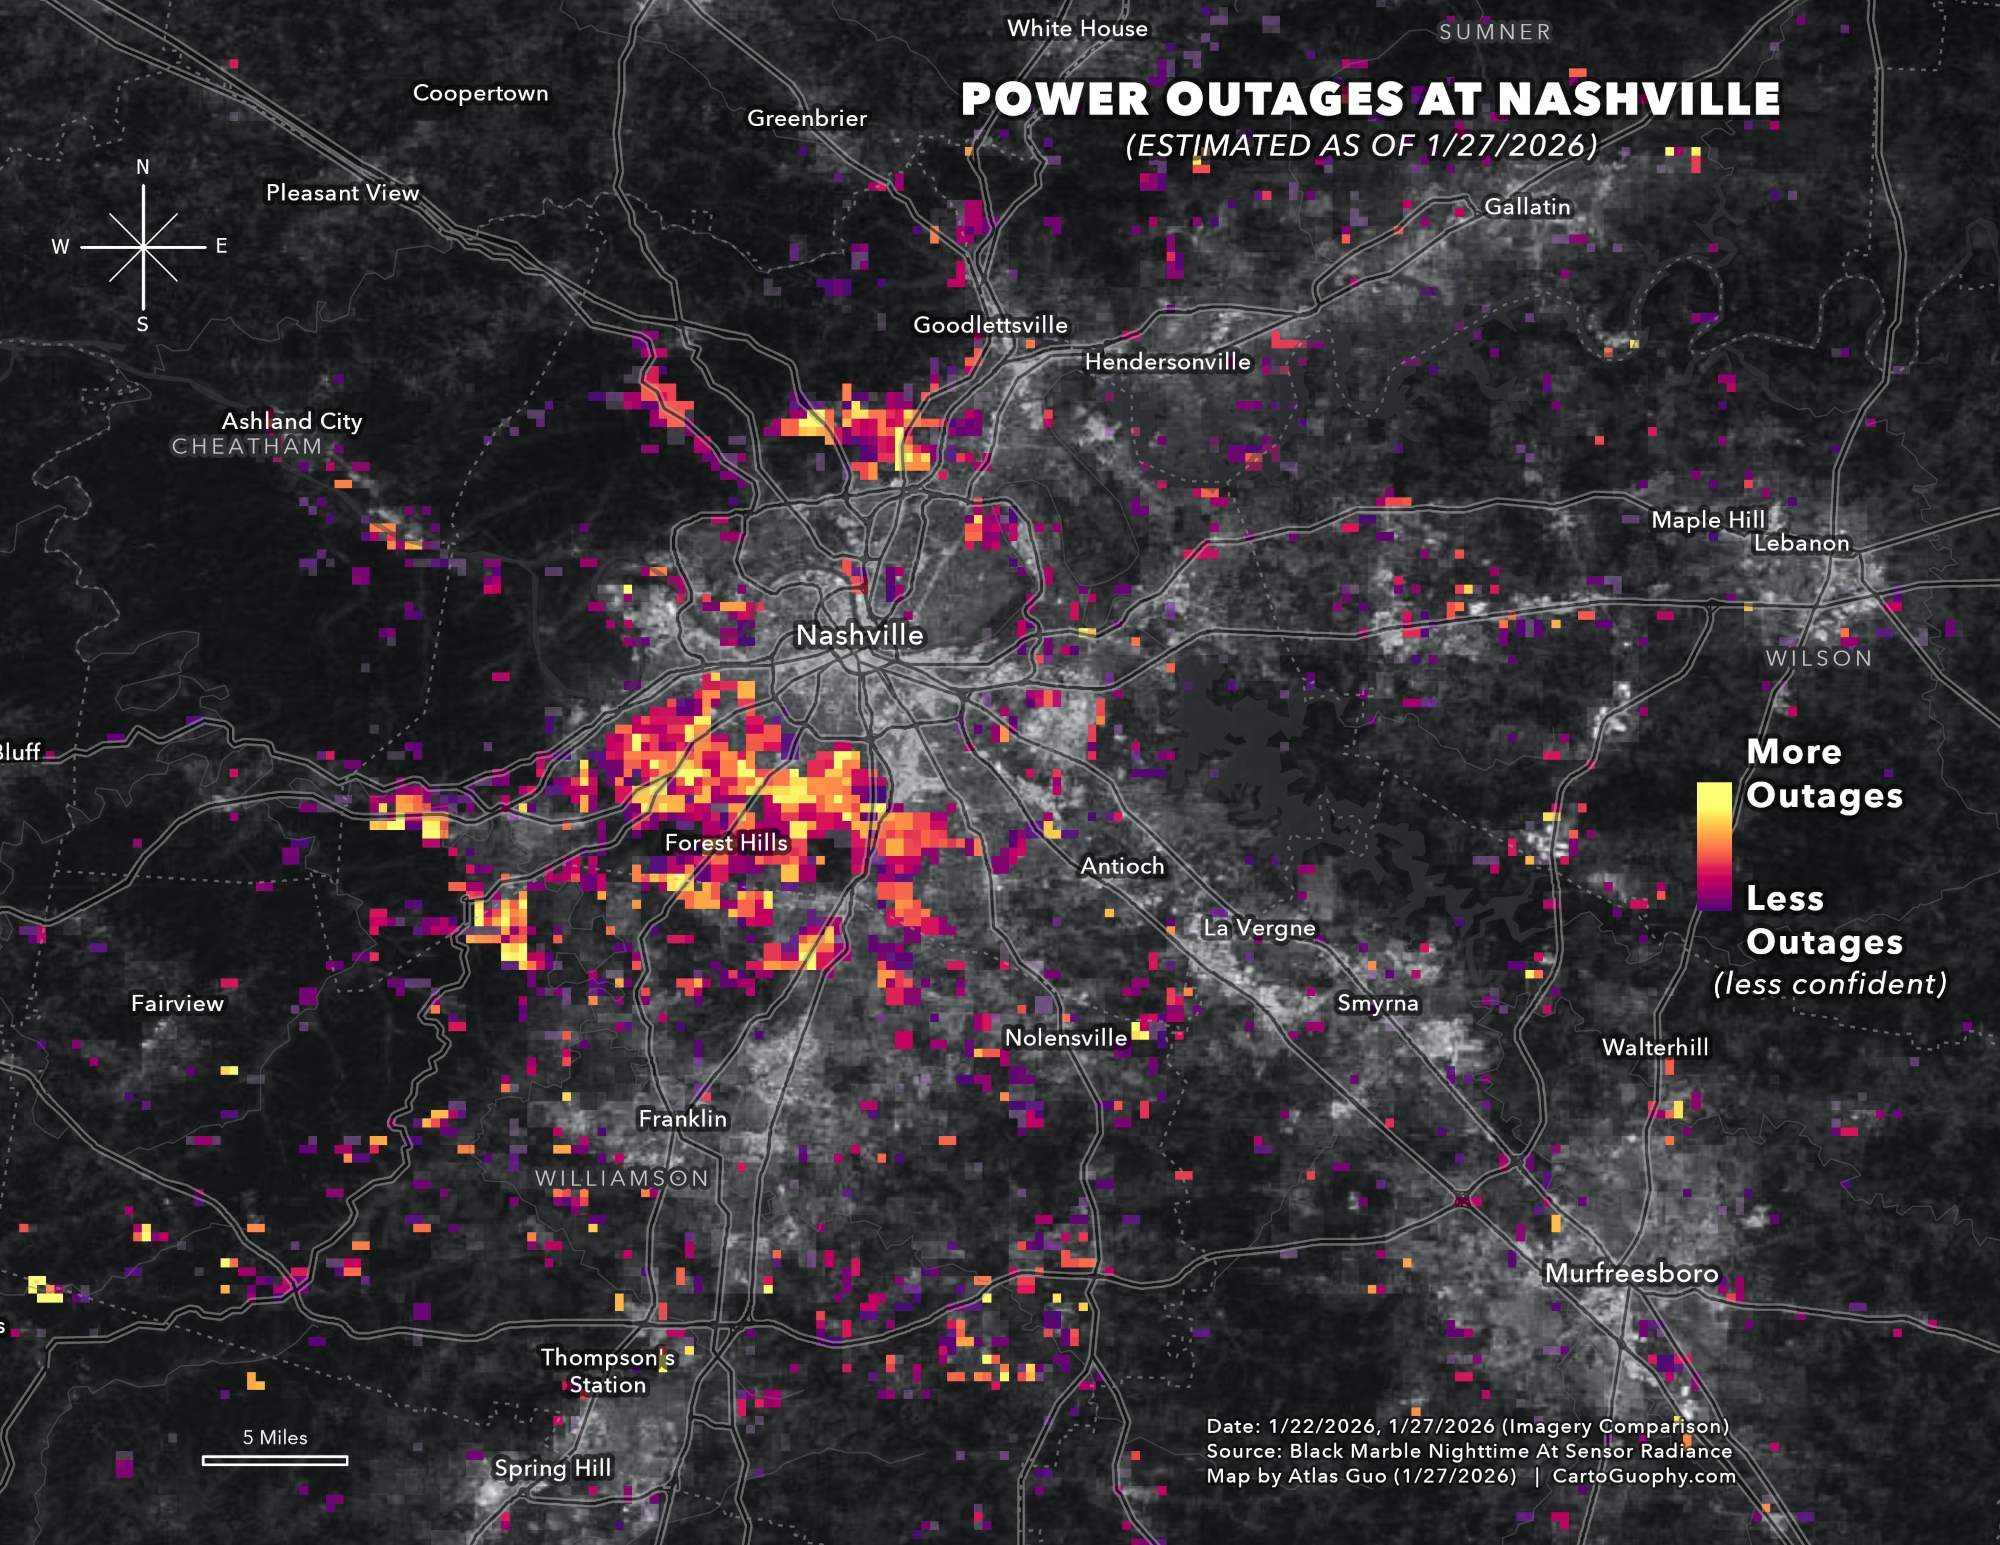
I used satellite imagery over Nashville, TN from before (1/22) and after (1/27) the recent WinterStorm to estimate the power outage at a finer spatial scale, based on changes in nighttime radiance. Data source: NASA Black Marble Nighttime At Sensor Radiance.
This map is the Runner-Up of Thematic Map Category in Wisconsin Land Information Association (WLIA) 2026 Map Contest.