Visualizations on U.S. Winter Storm
Series of static maps and web application visualizing NOAA WSSI dataset
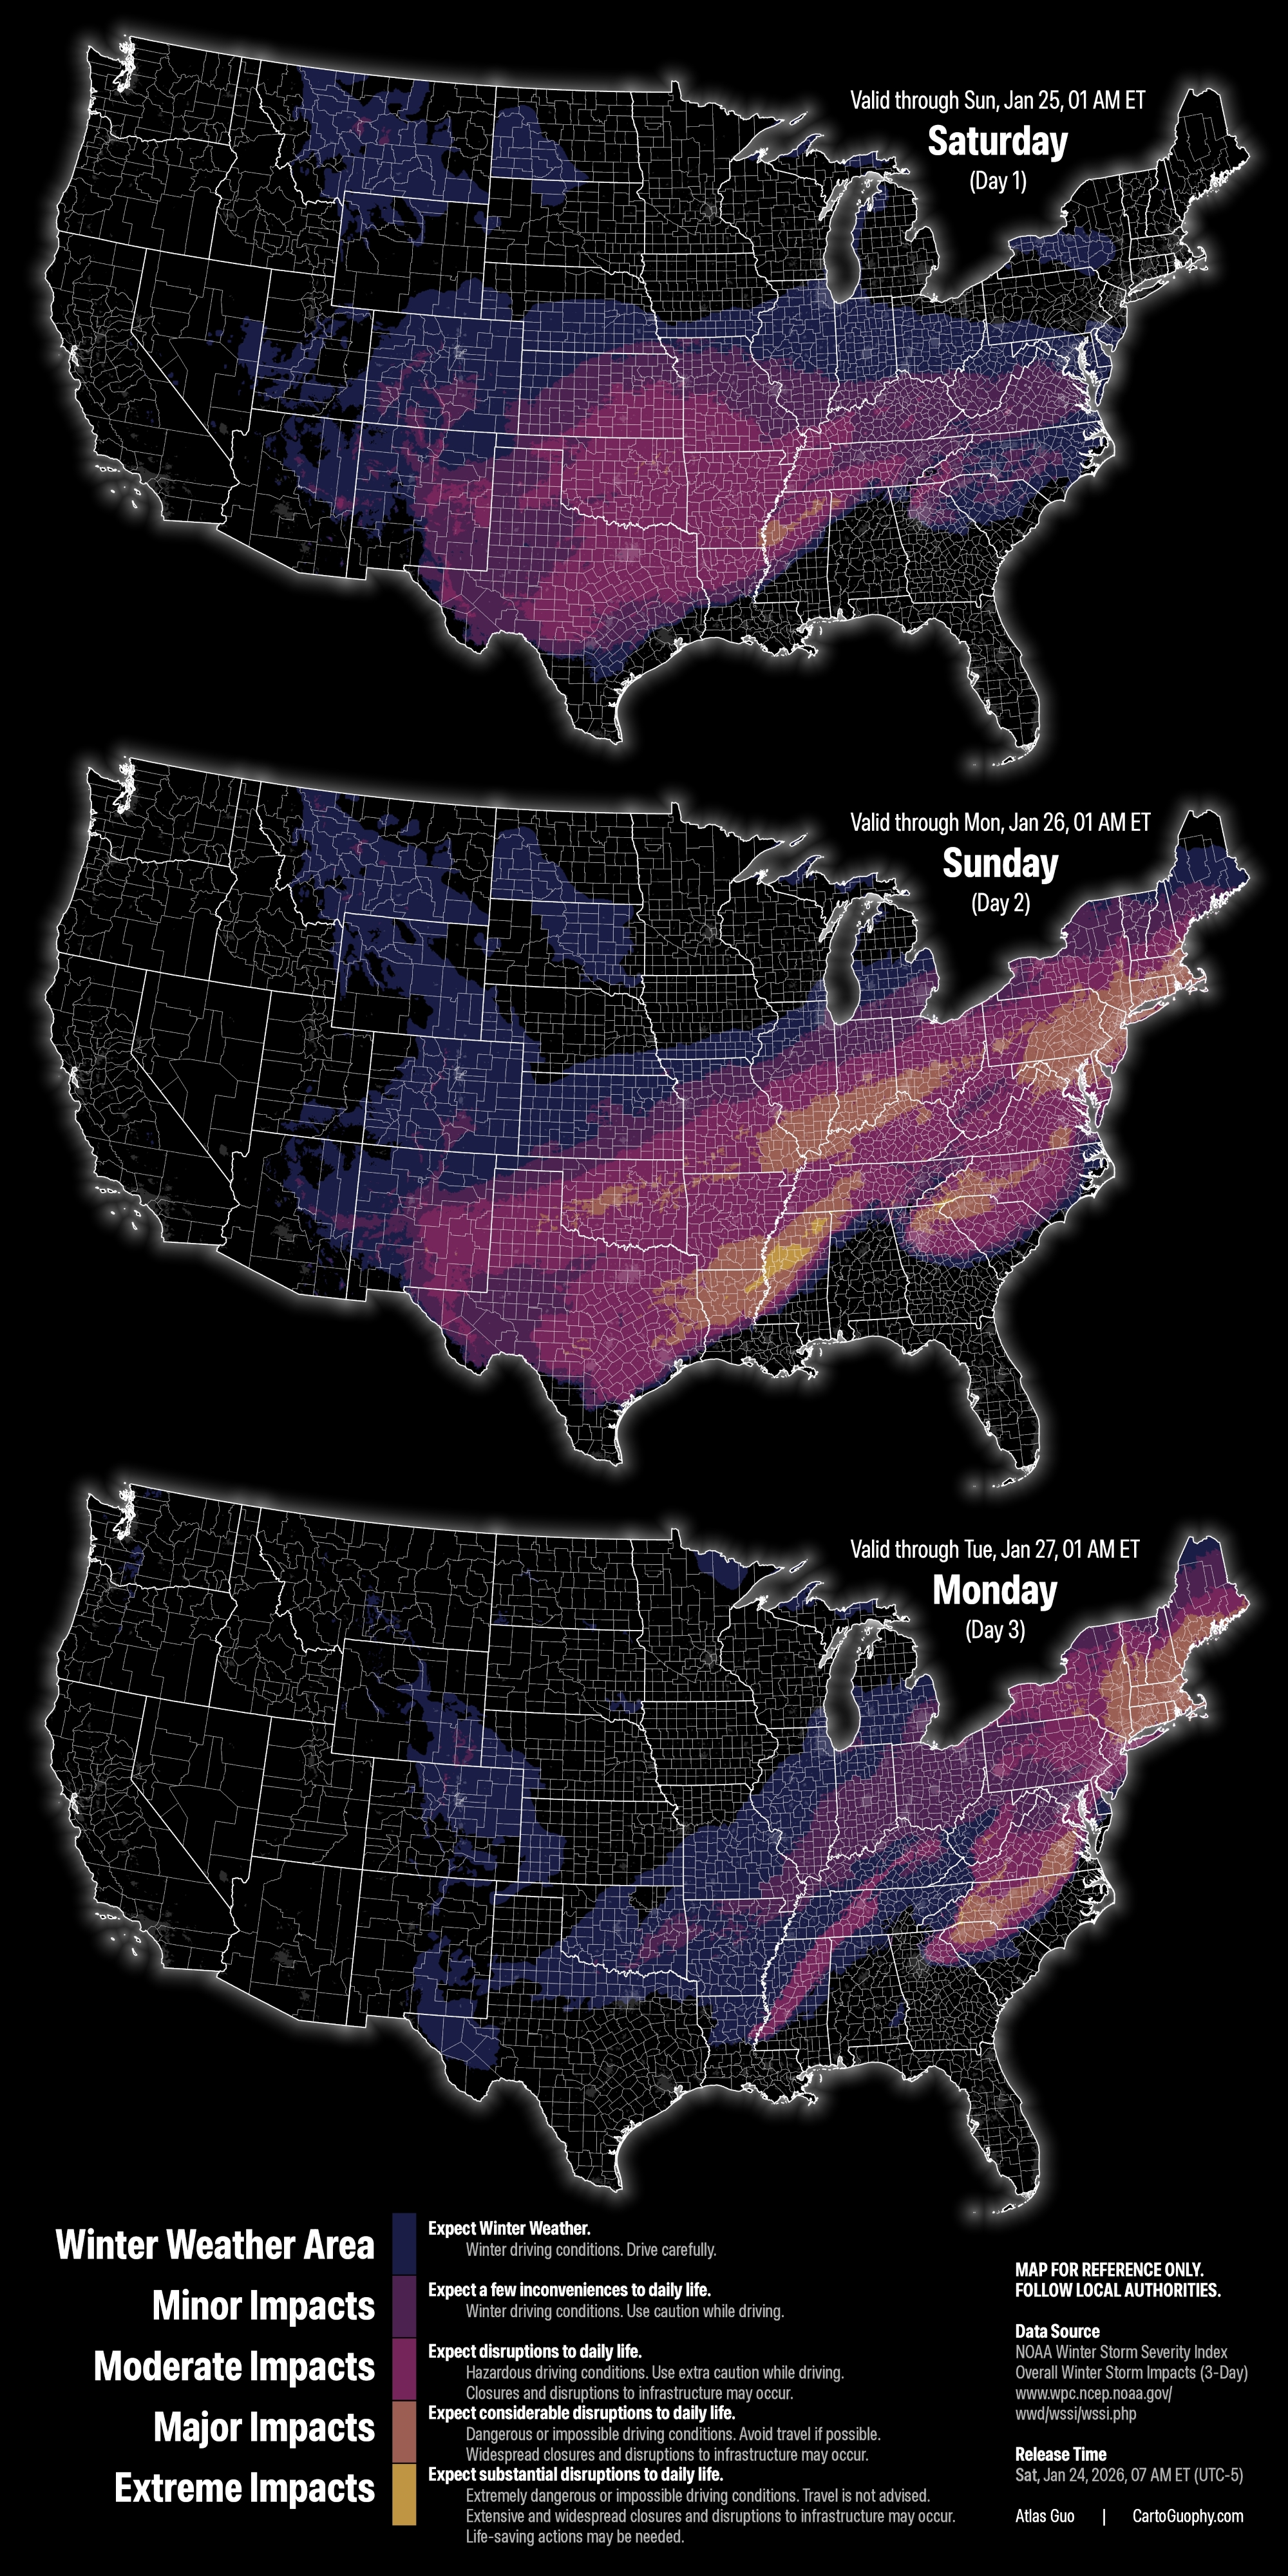
Increasing situational awareness around hazards is always worthwhile, and effective disaster maps are never excessive. With NOAA's Winter Storm Severity Index (WSSI) dataset, I made this map of the Jan 2026 U.S. winter storm with such practices: a dark background to save battery during power outages, a vertical layout optimized for phone viewing and sharing, a colorblind friendly design, and clear county and city references for quick orientation.
 Download Compressed Image
Download Full-Size Image
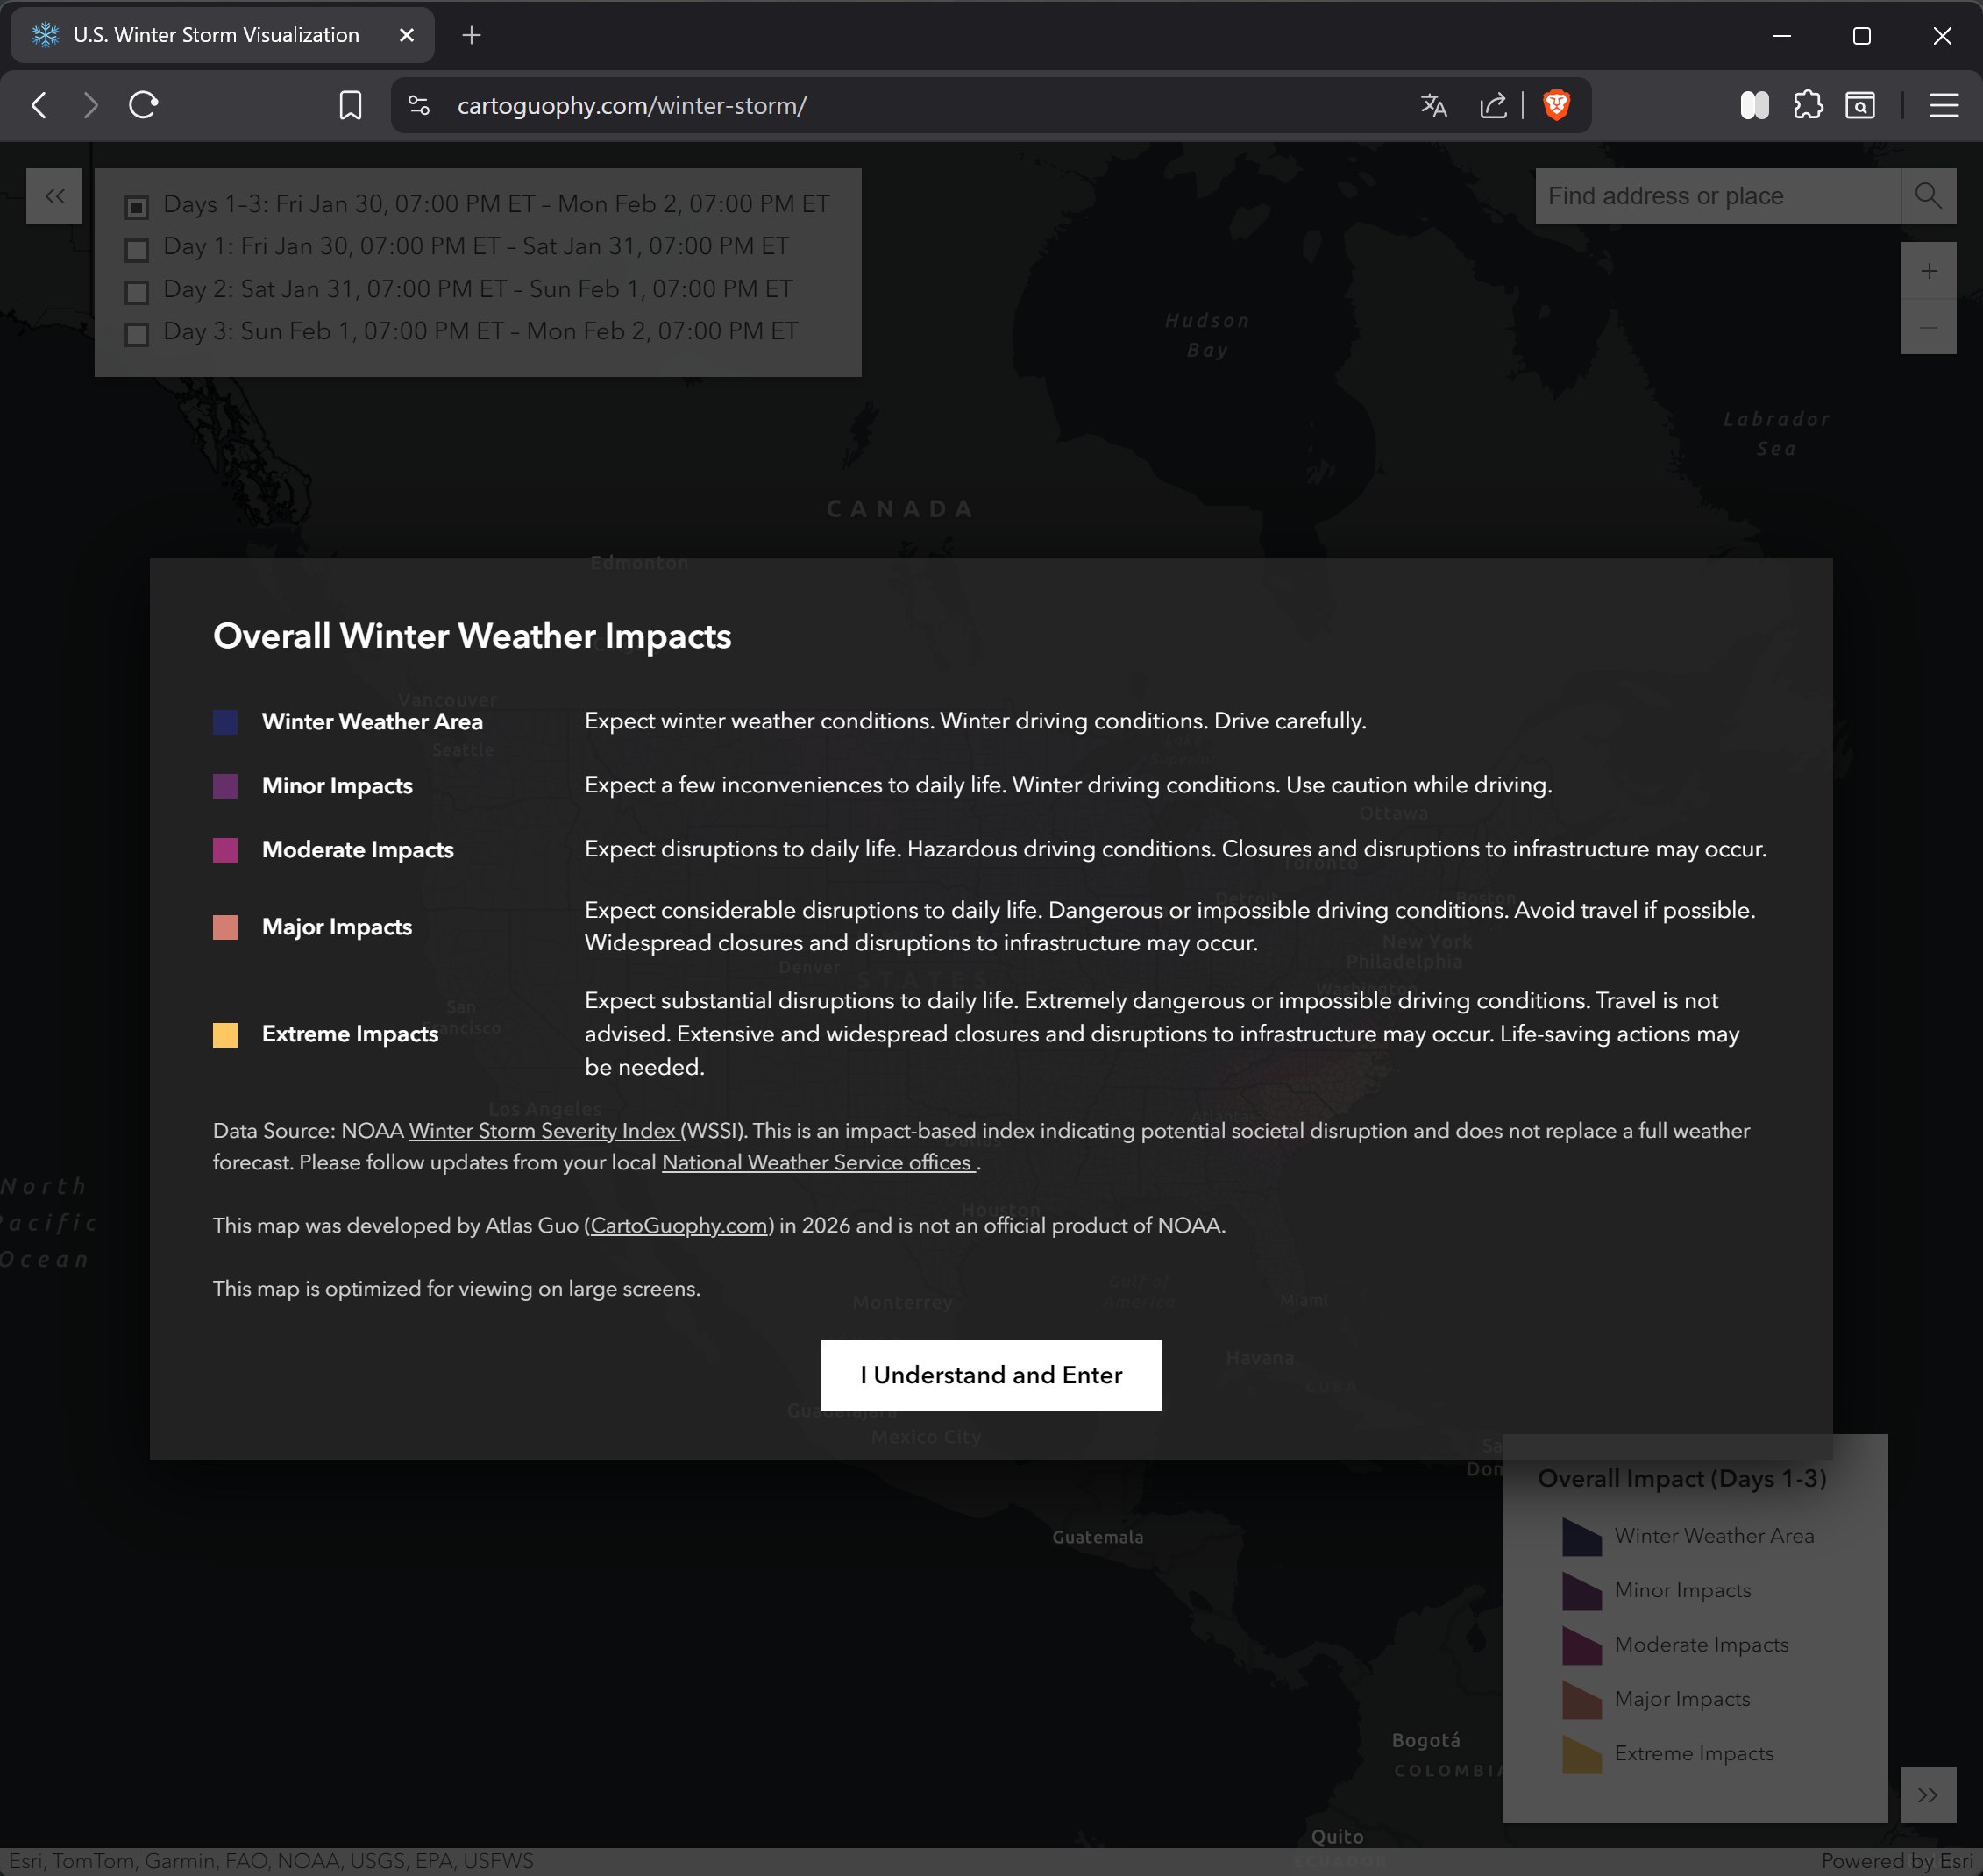
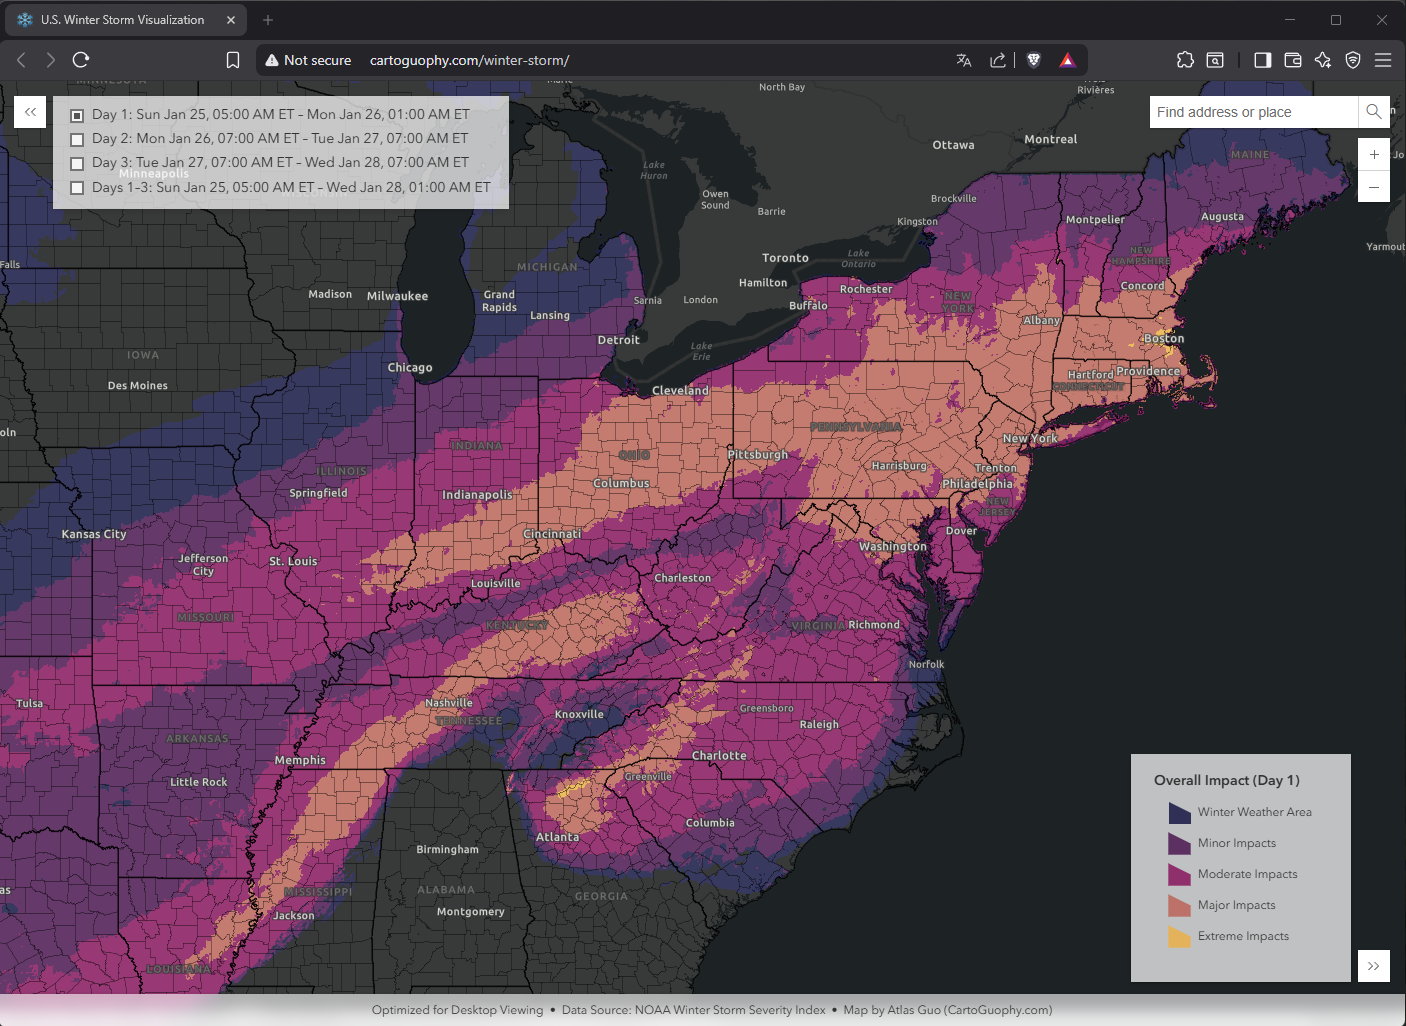
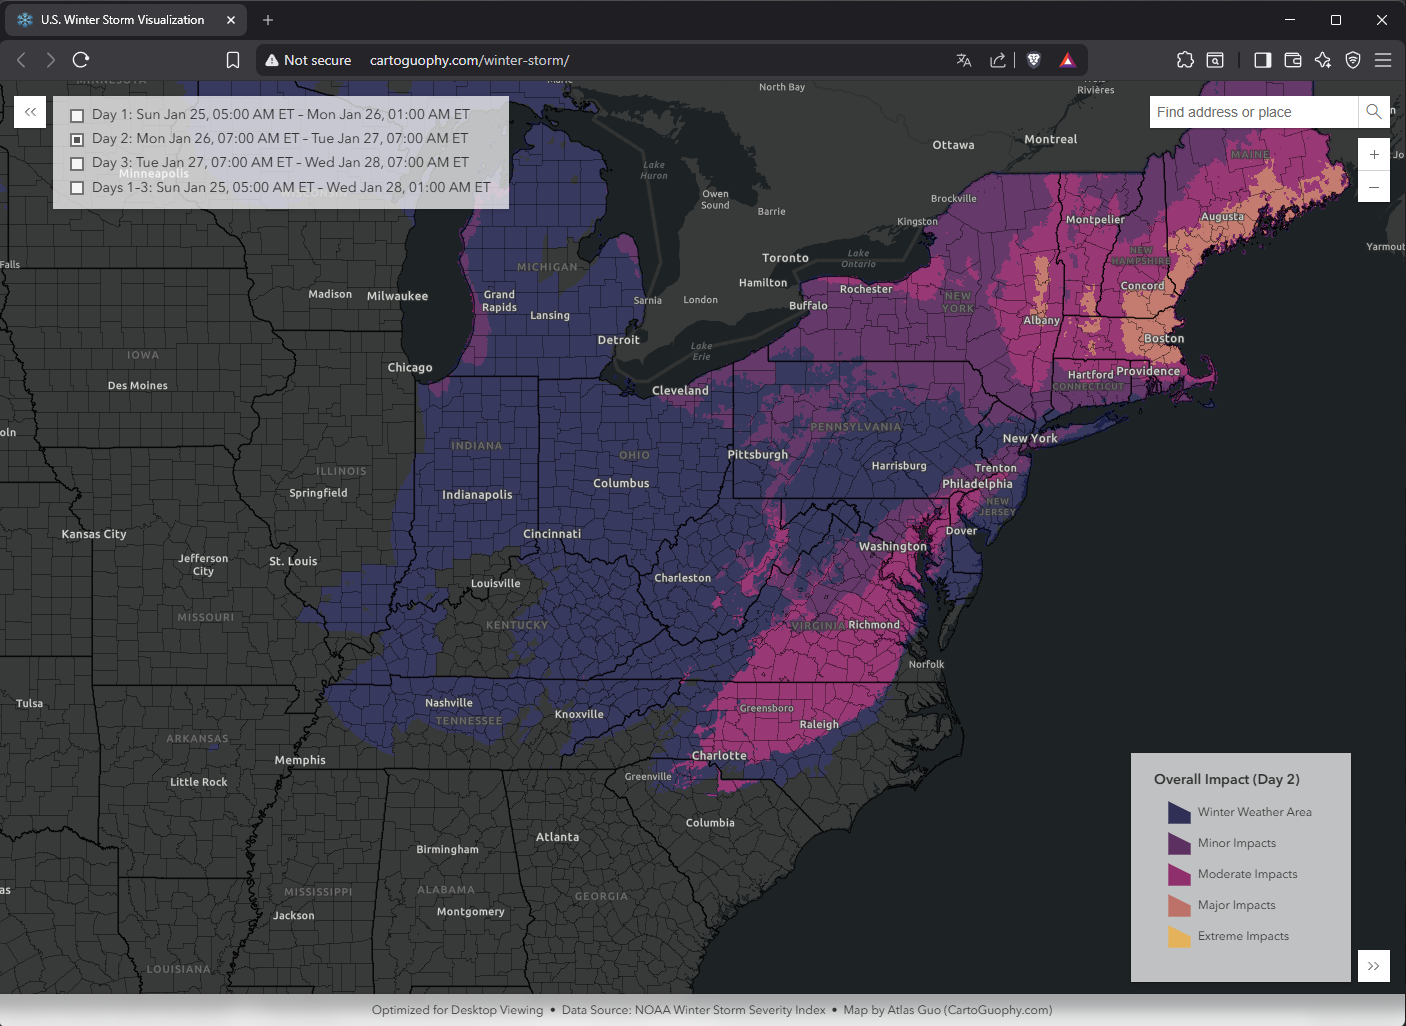
After this version on Saturday morning (Jan 25), I made some updated versions on Saturday evening and Sunday morning (Jan 26) to reflect the latest changes. After realizing the roughly 2-hr updating frequency, I turned it into a web map (https://cartoguophy.com/winter-storm/) with Esri's JavaScript SDK, so everyone can view the impacts for the next 1-3 days at any time. Due to the limited time, it is not optimized for small screens, so desktop viewing is recommended.
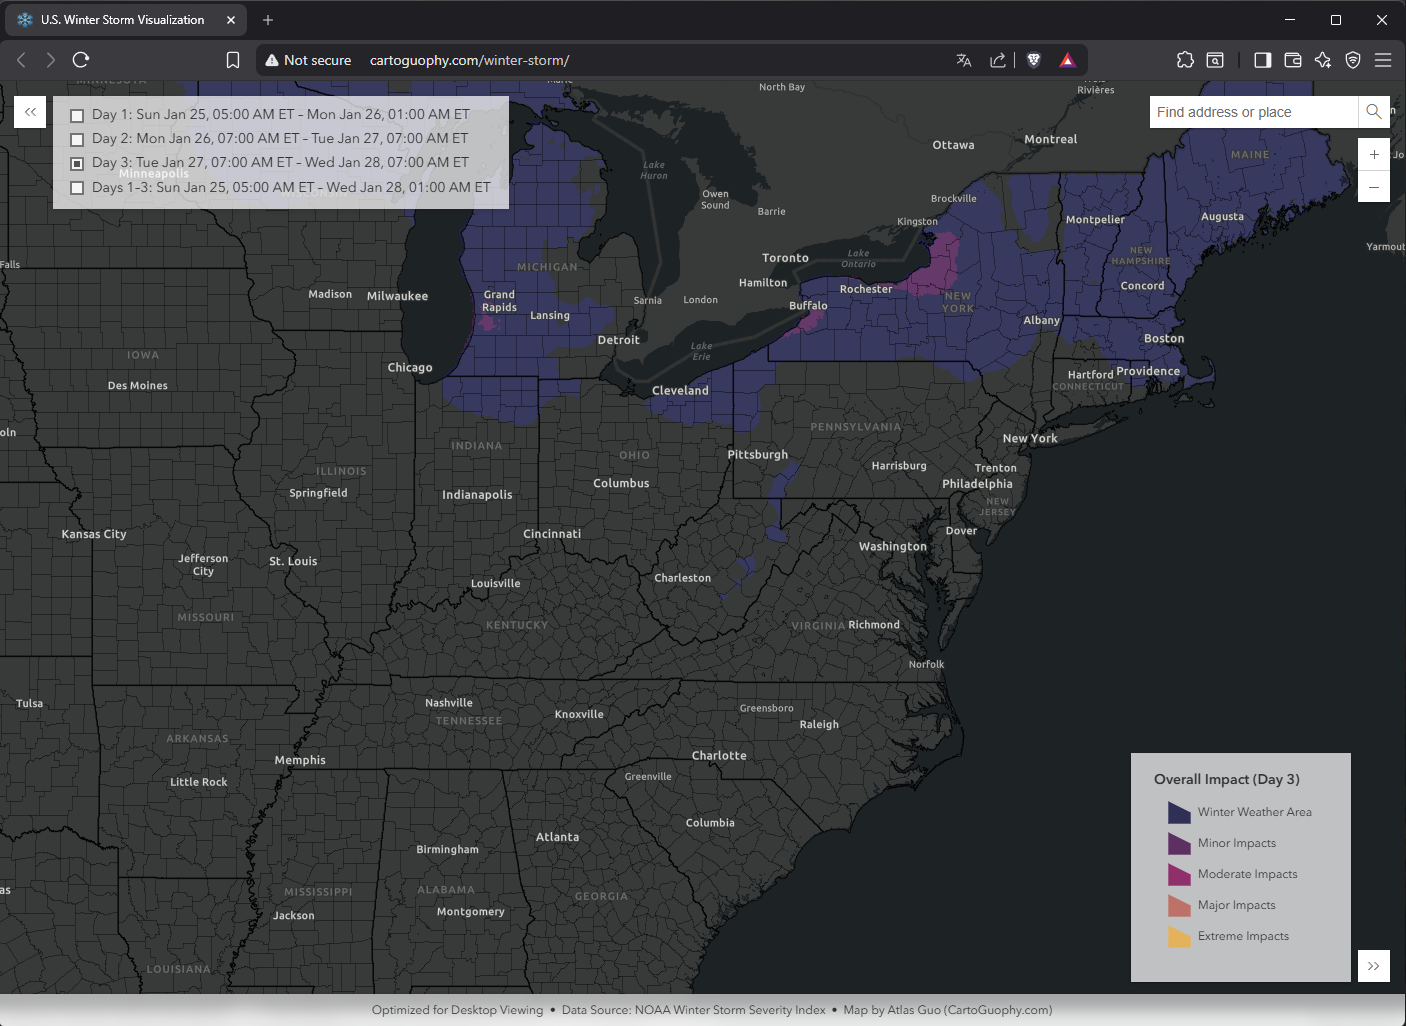 View Web Map